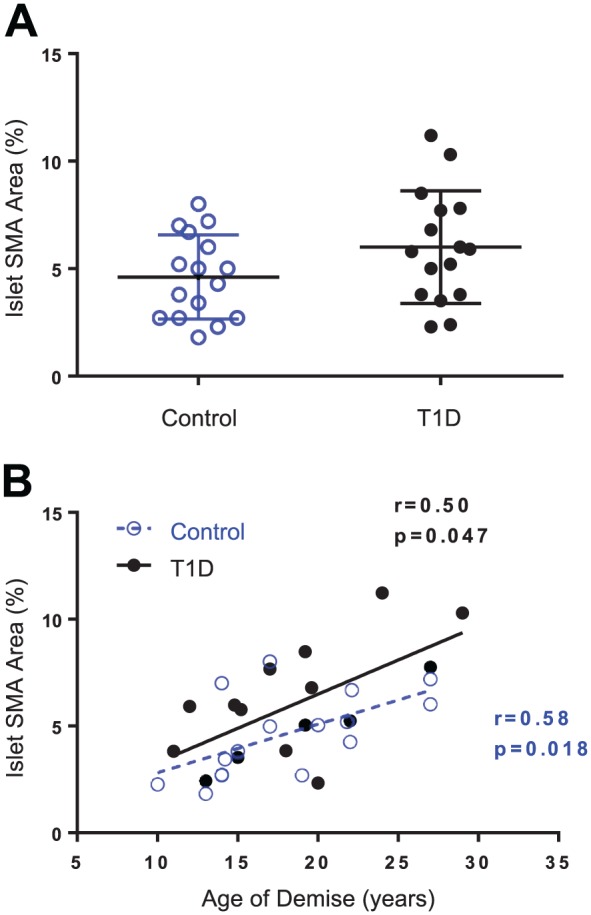
Figure 6.

Islet SMA area and donor age. Pancreas sections were stained and image analysis performed as described in section “Materials and Methods” for 16 control donors (N=10 islets/donor) and 17 donors with type 1 diabetes (N=7–20 islets/donor). Islet SMA area (%) was plotted by donor group (A) and by age (years) for control donors (blue open circles, A) and diabetic donors (black closed circles, B). Islet SMA area was not significantly different between donor groups (Student’s t-test, p=.151) but was significantly correlated with donor age in both groups (B). Linear regression line plotted with Spearman’s r and p values, control slope = 0.23 ± 0.08, T1D slope = 0.32 ± 0.1. Abbreviations: SMA, smooth muscle actin; T1D, type 1 diabetes.
