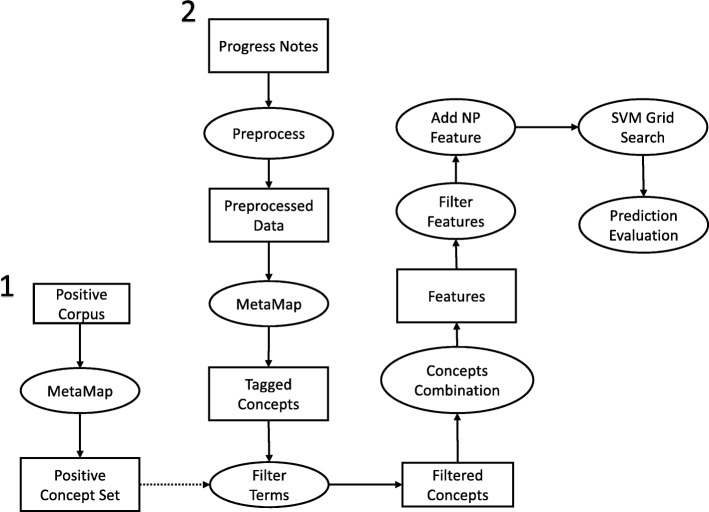
Fig. 1.
Diagram of the workflow of the study. Processing steps are in the circles; narratives, concepts, and features are in the squares. NP represents the number of pathology reports generated at least 120 days after the first primary diagnosis. We start with pipeline 1 by manually going through a development corpus of 50 randomly selected positive progress notes to build a positive concept set. We then start pipeline 2 by going through every patient’s progress notes. The dash line indicates that only concepts falling in the positive concept set are retained

