Fig. 5.

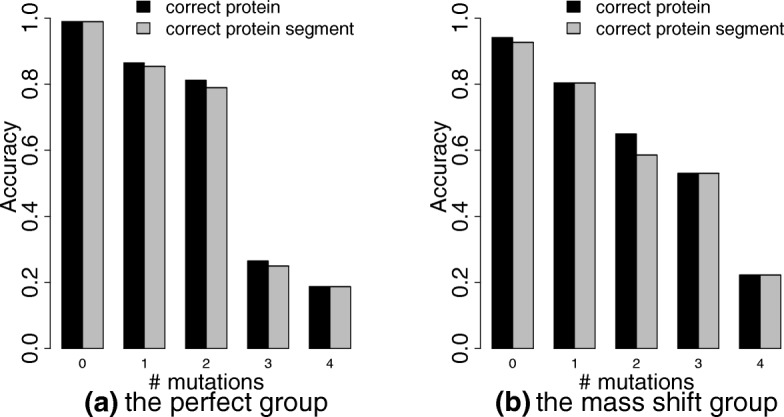
The CP and CS rates for the spectra in the 5 perfect subgroups G0, G1, G2, G3, G4 and in the 5 mass shift subgroups H0, H1, H2, H3, H4. (a) The perfect group; (b) the mass shift group

The CP and CS rates for the spectra in the 5 perfect subgroups G0, G1, G2, G3, G4 and in the 5 mass shift subgroups H0, H1, H2, H3, H4. (a) The perfect group; (b) the mass shift group