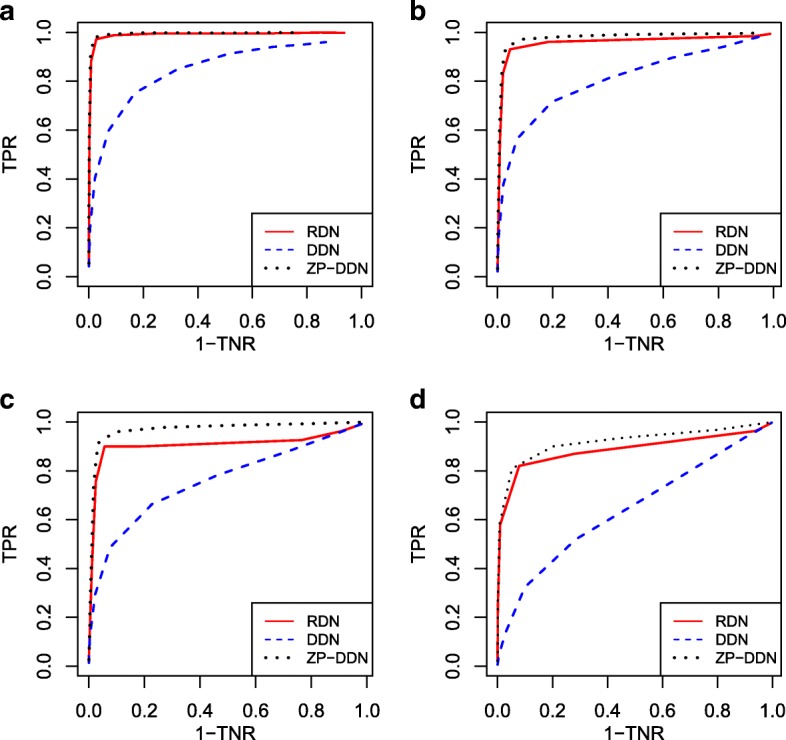
Fig. 2.

Receiver operating characteristic curves under Gaussian copula model with dimensionality varying from 50 to 120. The red line represents the proposed RDN method, the black dotted represents the benchmark method ZP-DDN, the blue dotted line represents DDN method. a Scenario 3, p = 50. b Scenario 3, p = 80. c Scenario 3, p = 100. d Scenario 3, p = 120
