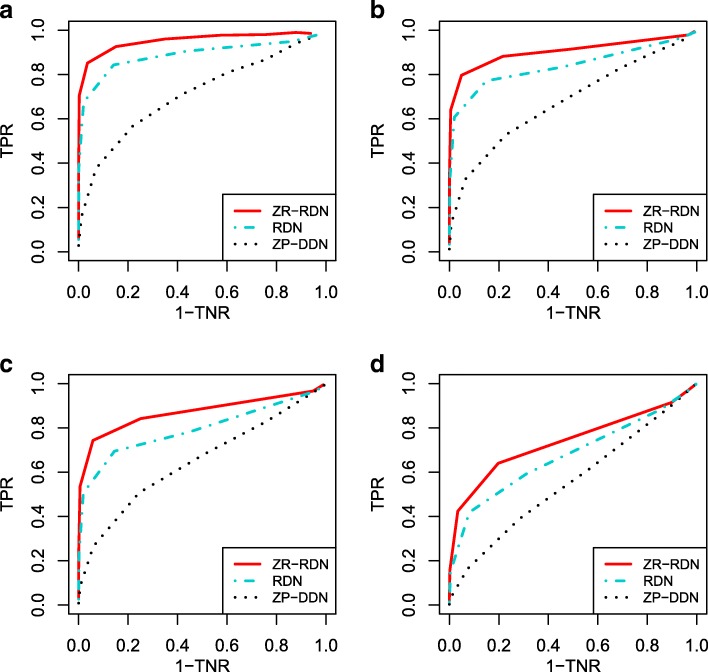
Fig. 4.
Receiver operating characteristic curves for Scenario 3 under latent Gaussian copula model, with dimensionality varying from 50 to 120. The red line represents the proposed RDN method, the black dotted represents the benchmark method ZP-DDN, the blue dotted line represents DDN method. a Scenario 3, p = 50. b Scenario 3, p = 80. c Scenario 3, p = 100. d Scenario 3, p = 120

