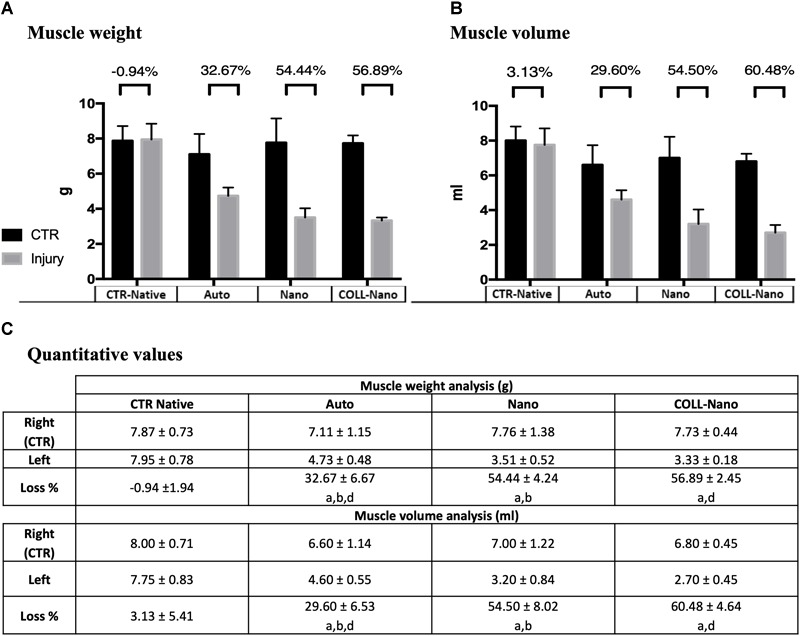
FIGURE 6.

Quantitative results of muscle’s weight and volume loss. Graphics (A,B) show the muscle weight and volume quantitative results of the injured (gray) and right leg control (black) of the operated animals of each experimental condition (Auto, Nano, and Coll-Nano) and native control (CTR). Table in (C) shows the weight and volume mean ± standard deviation values in grams (g) and milliliters (ml), respectively. Furthermore, the muscle atrophy is indicated by the % of loss between the CTR and injured leg of each animal. In this study, significant differences are indicated as follows: aSignificant differences with CTR group. bSignificant differences between Auto vs. Nano group. cSignificant differences between Nano vs. Coll-Nano group. dSignificant differences between Auto vs. Coll-Nano group. p < 0.05 values were considered statistically significant in two-tailed tests.
