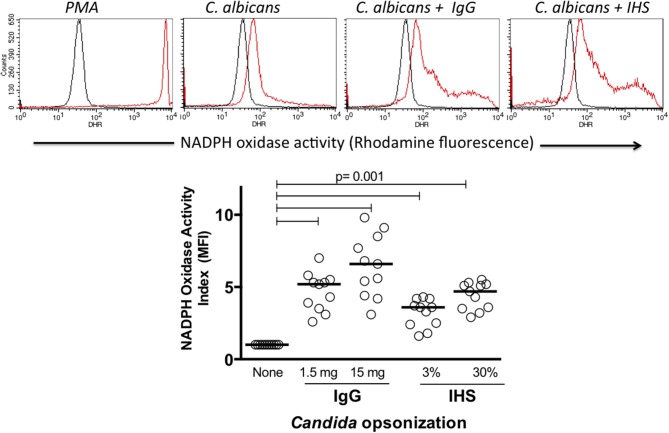
Figure 2.
Upper histograms: example of NADPH oxidase assessment in blood leukocytes by flow cytometry (dihydrorhodamine assay). Black and red histograms indicate unstimulated and stimulated cells, respectively. The lower dot plot summarizes the NADPH oxidase stimulation indices of 11 healthy donors. IgG, commercial human polyvalent IgG IV IgG; IHS, immune human serum. Statistical test: Wilcoxon.

