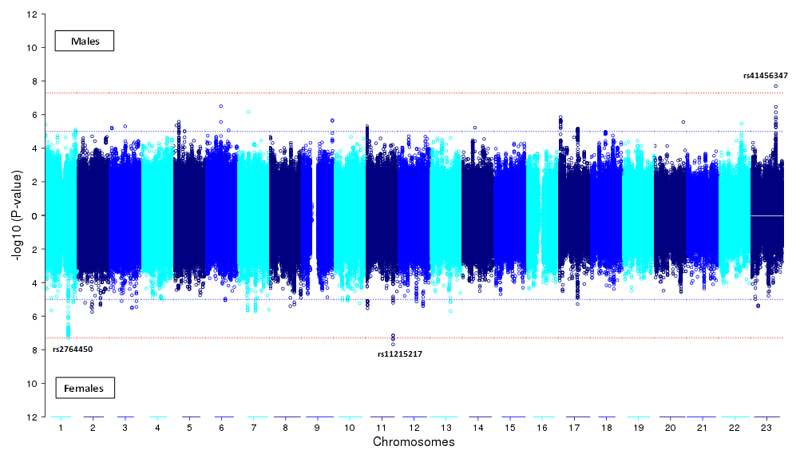
Figure 1. Miami Plot Showing P Values of the Single-Nucleotide Polymorphism Associations With Antisocial Behavior in Males and Females.
The threshold for genome-wide significance (P < 1.67 × 10⁻⁸) is indicated by the red dotted line, and the threshold for promising findings(P < 1.0 × 10⁻⁵) is indicated by the blue dotted line.

