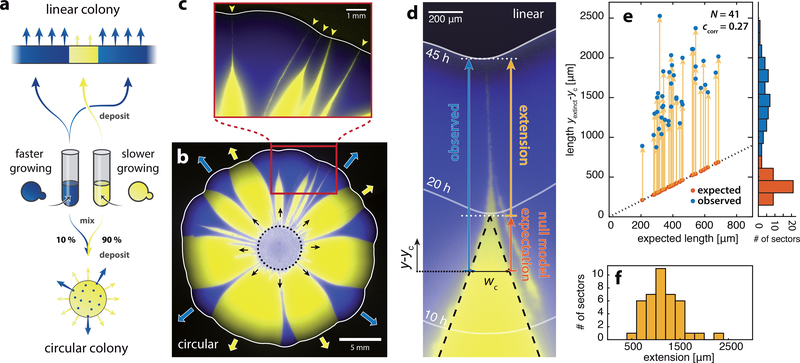
Figure 1: Slower-growing clones persist at the front of expanding yeast colonies.
a) Schematic of experimental setup. Competition experiments were conducted with a faster-growing (yMM9, false-color blue) and a slower-growing yeast strain (yJK22, yellow) with growth-rate deficit s = −0.06. Circular colonies were inoculated from a mixture of both strains (initial fraction of faster-growing cells was 10%). In linear colonies sectors expanded from flat fronts composed of extended regions with alternating cell types. b) Circular colony grown for 8 days from a mixture of both cell-types (dotted circle indicates area of cell deposition). Monoclonal “sectors” remain well-separated and expand outward at different rates (blue and red arrows). c) Sectors of the slower-growing strain form an inverted funnel shape with elongated tips (yellow arrowheads) that persist at the front before being completely expelled. d) Image of a mutant sector (yellow) being expelled from a linear colony (see movie S1 for a complete time lapse and Supplementary Fig. S1 for experimental setup). Same strains and colors as in a-c. Solid white lines mark the front position at the indicated times after inoculation. Dashed black lines delineate the sector shape predicted by the null model (local front speed only depends on cell type), and wc ≈ 230μm is the characteristic width below which observations deviate from null model predictions (see Supplementary Fig. S3 for assessment of wc). Sector extension (yellow arrow) is the difference between observed sector length (blue arrow) and the null model expectation (orange arrow). Positions along axis of sector expansion, y, are measured relative to yc, the position at which wc = w(yc). e) Observed clone lengths (blue dots) as a function of expected length (also indicated as orange dots) for N = 41 sectors. yextinct indicates the position of clone expulsion from the front. Yellow arrows indicate sector extension (see panel d). Histograms show binned distributions of expected and observed lengths. ccorr is the Pearson correlation coefficient of both lengths. f) Histogram of the sector length extensions (yellow arrows in panel e). Sectors are significantly (p-value < 10−29) extended by an average of 1150 ± 340μm.

