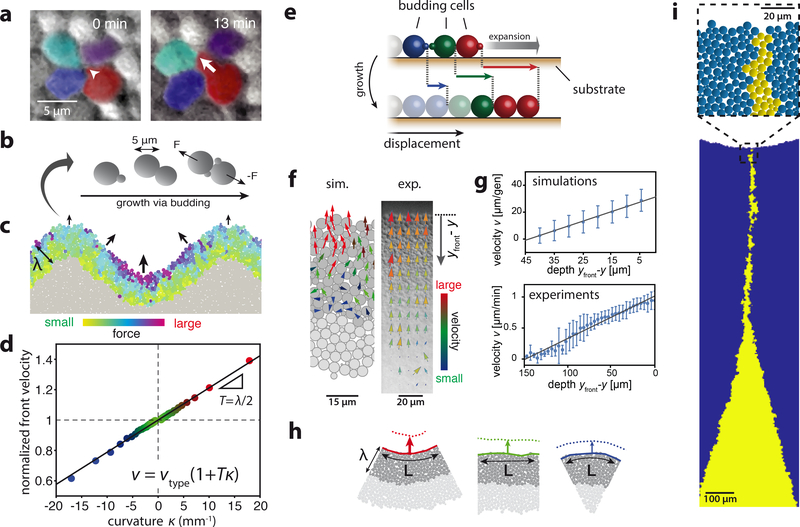
Figure 3: Effective surface tension emerges in mechanical simulations from purely physical cell-cell interactions.
a) A budding cell (red, white arrow indicates bud growth) displaces neighboring cells. b) Schematic of cell-based simulations (see Methods and Supplementary Video S6 for simulation description). c) Total force on each cell from all intercellular contacts (colored cells) for cell-based simulations of a highly-curved growth layer (depth λ = 45μm, see Methods and Supplementary Fig. S14 for parameterization). Arrows indicate resulting front cell motion. d) Front velocity as a function of curvature κ, normalized to the velocity for a flat front (κ = 0). Curvature is defined as positive for inward divots and negative for outward bulges. The black line indicates v ∝ 1 + Tκ with T = λ/2 (see Supplementary Information Sec. 2 for derivation of relationship between T and λ ). Colors correspond to curvature as in h. e) Schematic of cumulative cell-cell pushing. Colors identify mother-daughter pairs with solid cells indicating the growth layer. Displacements of individual cells towards the front (right) upon growth are indicated by respective colored arrows. The gray arrow denotes resulting front expansion. f) Tracking cell movement inside the growth layer. Simulations: Arrows represent center-of-mass motion of budding cells (dark gray) with colors indicating total velocity magnitude. Experiments: Cell motion obtained via particle image velocimetry (see Methods). Arrows represent measured velocities with colors indicating arrow lengths for better visualization. g) Average forward velocities as a function of depth yfront −y (see panel f). Error bars indicate one standard deviation from the mean. Solid lines are calculated expected values (simulations) or a linear fit to the data (experiments). Experimental data is based on Supplementary Video S5 (2h after start, see Supplementary Fig. S7 for later time points). h) Depicted images are representative sections from simulated colonies with a constant front curvature. The number of growing and pushing cells (dark gray) per unit arc length L of the front depends on the curvature κ. Arrows indicate resulting front velocities (see panel d for quantification and color labeling). Front profiles (solid and dotted lines) are separated by 1/2 generation. i) Slower-growing clones in cell-based simulations (s = −0.06) exhibit a delay in extinction similar to experiments (see Supplementary Fig. S14 for comparison of simulations to experiments). The image is a snapshot of Video S2 at 35 generations.

