
Figure 1 -.
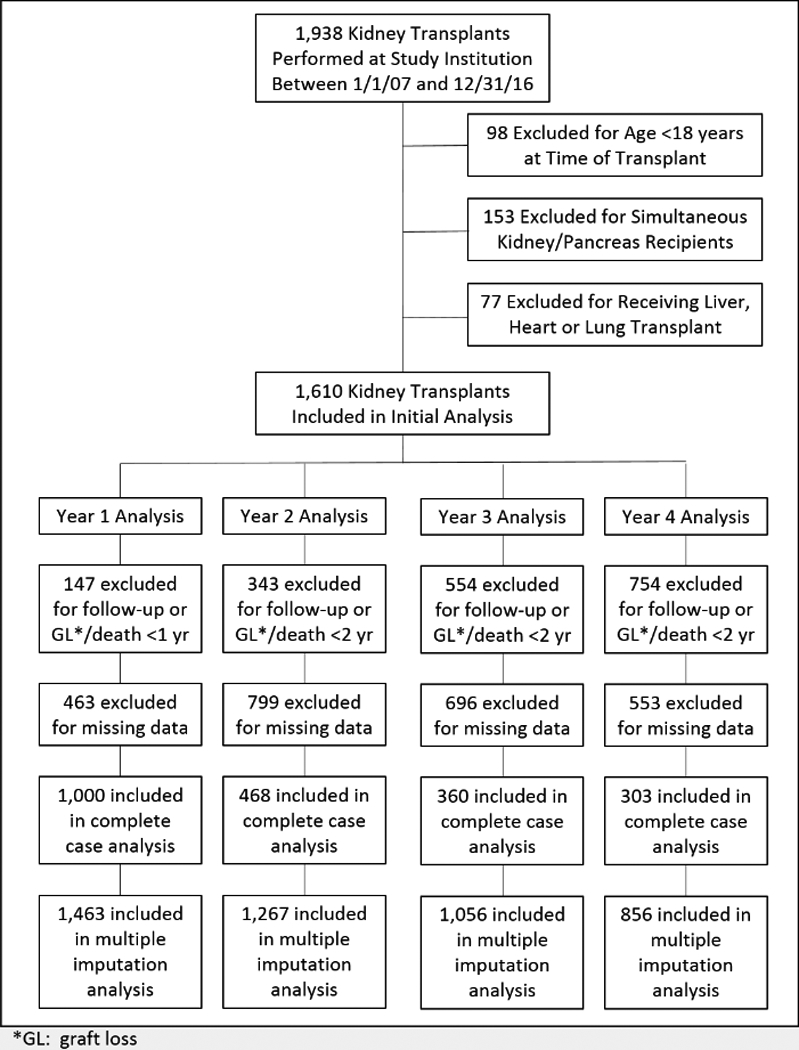
Consort flow diagram displaying how the final cohort was created, as well as each yearly cohort within the four landmark analyses. Final cohort sizes within each post-transplant year for both the complete case and multiple imputation analyses are included as well.