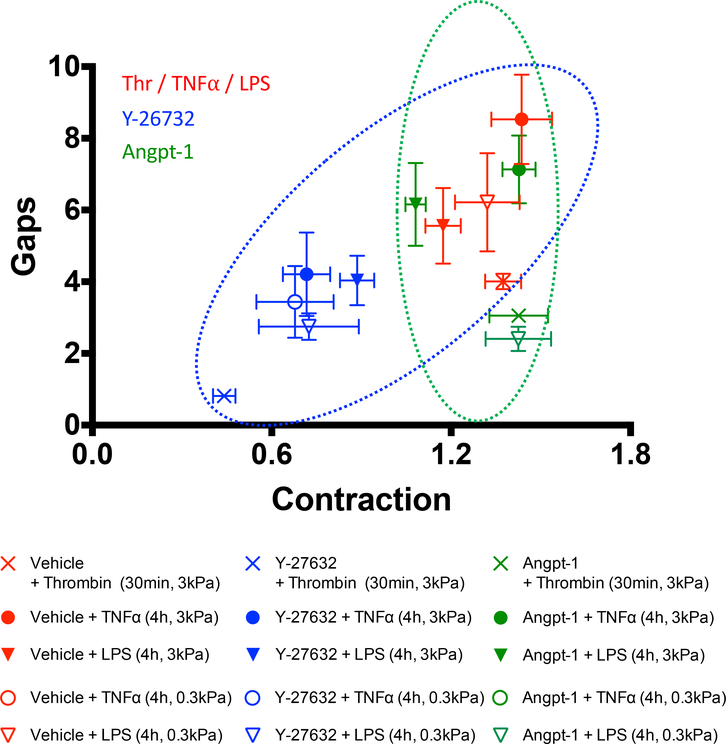
Figure 3: Barrier protection by Y-27632 is correlated with a reduction of cellular contractile forces whereas barrier protection by Angpt-1 is not.
Plotted is gaps versus contraction for the indicated conditions. For gaps, we report changes normalized to vehicle. For contraction, quantities have been normalized to t=0min values and then to the vehicle group. Each treatment group comprises of measurements performed over n=7–16 individual wells of a 96-well plate. Plotted is the mean and standard error. Symbols in red, blue and green correspond to the LPS/TNFα/thrombin, Y-27632 and Angpt-1 treatments, respectively. The ellipses highlight contractile force dependent (blue) or independent (green) reduction of thrombin-, LPS, and TNFα-induced gap formation. A lack of concordance for the EC response to TNFα on the soft substrate remains unclear (Fig. S8).

