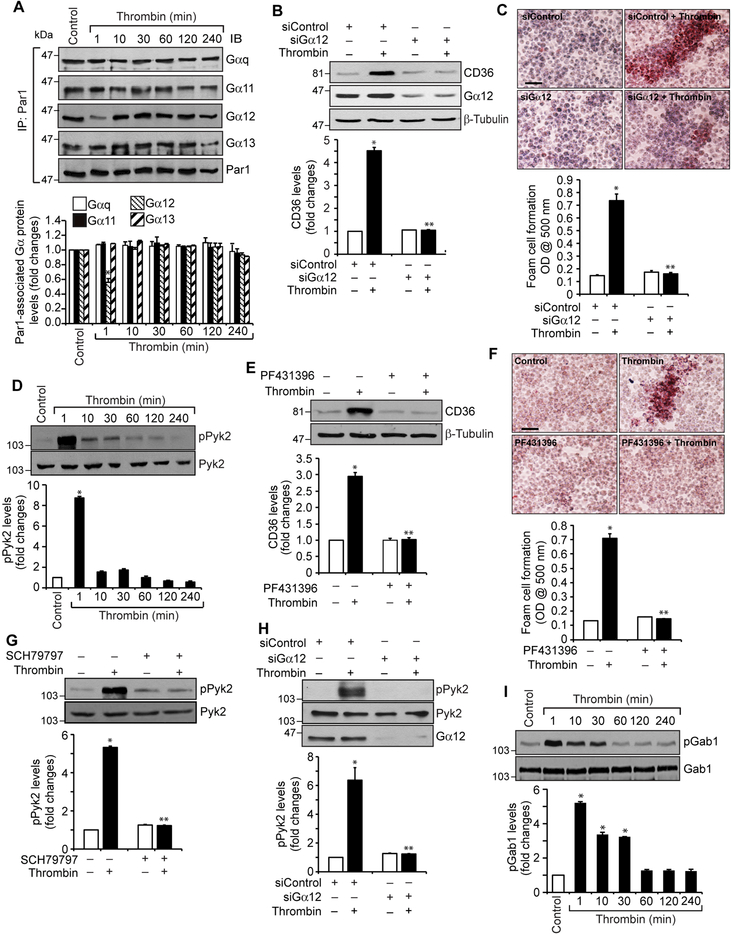
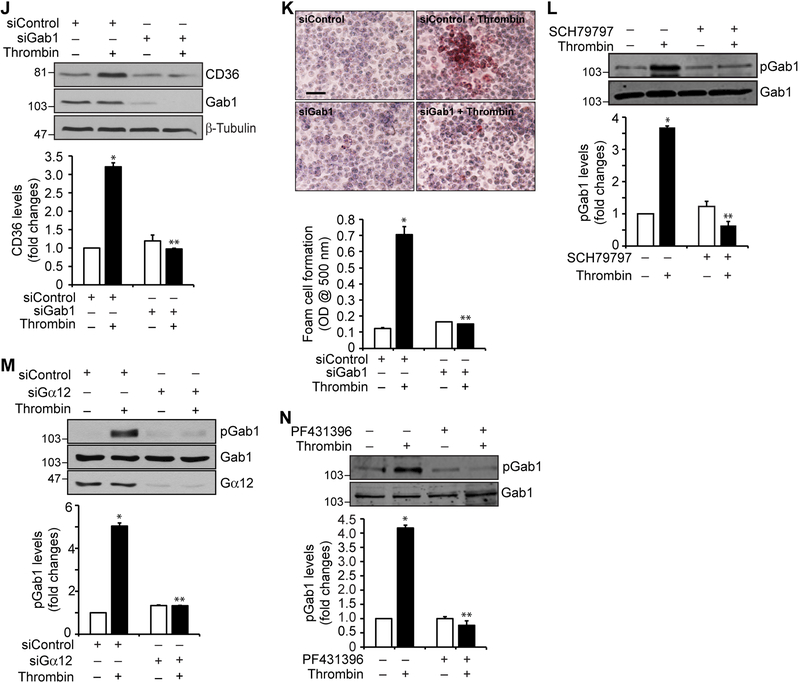
Figure 2. Gα12, Pyk2 and Gab1 mediate thrombin-induced CD36 expression and foam cell formation.
A. Equal amounts of protein from control and the indicated time periods of thrombin-treated cells were immunoprecipitated with anti-Par1 antibodies and the immunocomplexes were analyzed by Western blotting for Gαq, Gα11, Gα12 or Gα13 levels and the blot was normalized to Par1. B. Cells were transfected with siControl or siGα12 (100 nM), quiesced, treated with and without thrombin for 1 hr and analyzed by Western blotting for CD36 levels and the blot was reprobed for Gα12 or β-tubulin levels to show the effect of the siRNA on its target and off target molecules levels. C. Cells were transfected with siControl or siGα12 (100 nM), quiesced, treated with and without thrombin for 4 hrs and analyzed for foam cell formation. D. Extracts of control and the indicated time periods of thrombin-treated cells were analyzed by Western blotting for pPyk2 levels and the blot was normalized to its total levels. E. Quiescent cells were treated with and without thrombin in the presence and absence of PF431396 (5 μM) for 1 hr and analyzed by Western blotting for CD36 levels and the blot was normalized to β-tubulin levels. F. Quiescent cells were treated with and without thrombin in the presence and absence of PF431396 for 4 hrs and analyzed for foam cell formation. G. Quiescent cells were treated with and without thrombin in the presence and absence of SCH79797 (10 μM) for 1 min and analyzed by Western blotting for pPyk2 levels and the blot was normalized to its total levels. H. All the conditions were same as in Panel B except that after quiescence the cells were treated with and without thrombin for 1 min and analyzed by Western blotting for pPyk2 levels and the blot was reprobed for Pyk2 or Gα12 levels to show the effect of the siRNA on its target and off target molecules levels. I. Extracts of control and the indicated time periods of thrombin-treated cells were analyzed by Western blotting for pGab1 levels and the blot was normalized to its total levels. J & K. Cells were transfected with siControl or siGab1 (100 nM), quiesced, treated with and without thrombin for 1 hr or 4 hrs and analyzed for CD36 levels and foam cell formation, respectively. The CD36 blot was reprobed for Gab1 or β-tubulin levels to show the effect of the siRNA on its target and off target molecules levels. L. Quiescent cells were treated with and without thrombin in the presence and absence of SCH79797 (10 μM) for 1 min and analyzed by Western blotting for pGab1 levels and the blot was normalized to its total levels. M. Cells were transfected with siControl or siGα12 (100 nM), quiesced, treated with and without thrombin for 1 min and analyzed for pGab1 levels and the blot was reprobed for Gab1 or Gα12 levels to show the effect of the siRNA on its target and off target molecules levels. N. Quiescent cells were treated with and without thrombin in the presence and absence of PF431396 (5 μM) for 1 min and analyzed for pGab1 levels and the blot was normalized for its total levels. The bar graphs represent Mean ± S.D. values of three experiments. *, p < 0.05 vs control or siControl; **, p < 0.05 vs Thrombin or siControl + Thrombin. Scale bar is 50 μm.


