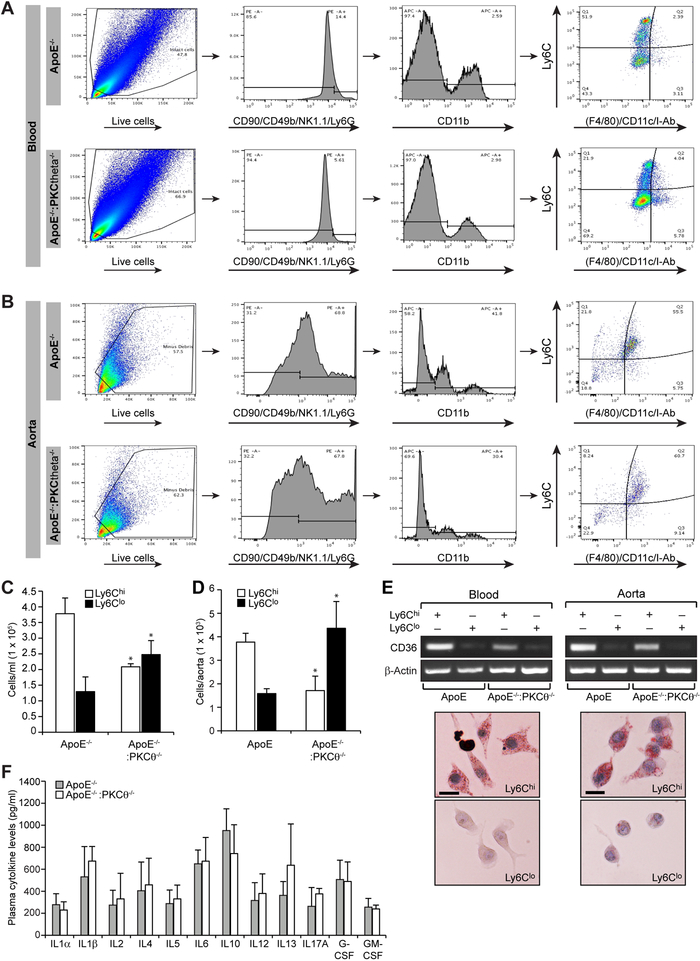
Figure 7. PKCθmediates diet-induced monocyte differentiation towards Ly6Chi phenotype in ApoE-/- mice.
A. Blood was collected from ApoE-/- and ApoE-/-:PKCθ-/- mice fed with WD for 16 wks, peripheral blood mononuclear cells were collected by density-gradient centrifugation, washed with RBC lysis buffer, resuspended into FACS buffer, blocked with mouse serum, washed with FACS buffer and incubated with fixable viability stain 450, anti-CD90-PE, anti-CD45R(B220)-PE, anti-CD49b-PE, anti-NK1.1-PE, anti-Ly6G-PE, anti-CD11b-APC, anti-Ly6C-FITC, anti-F4/80-PerCP-Cy5.5, anti-I-Ab-PerCP-Cy5.5 and anti-CD11c-PerCP-Cy5.5 antibodies. After washings, the cells were resuspended into sorting buffer and subjected to FACS analysis. The gating strategy is indicated as follows. Live cells (selected based on viability stain and higher forward scatter and lower side scatter) were gated as PE– cells (in gate I). CD11b monocytes were gated as APC+ cells from PE– cells (in gate II). CD11b+ monocytes were gated as Ly6ChiF4/80loCD11cloI-Ablo, Ly6ChiF4/80hiCD11chiI-Abhi, Ly6CloF4/80hiCD11chiI-Abhi and Ly6CloF4/80loCD11cloI-Ablo. All gates were set using full-minus-one (FMO) controls. The percentages of each CD11b+ monocyte subpopulations for all mice are indicated in the respective gate. B. Aortas from ApoE-/- and ApoE-/-:PKCθ-/- mice fed with WD for 16 wks were collected, digested with a mixture of collagenase I, collagenase XI, Dnase I and hyaluronidase, washed with Hank’s balanced salt solution, resuspended in FACS buffer and subjected to FACS analysis as described in panel A. The percentages of each CD11b+ monocyte subpopulations for all mice are indicated in the respective gate. C & D. The bar graphs represent the number of retrieved Ly6Chi and Ly6Clo cells in the blood and aorta of WD-fed ApoE-/- mice versus ApoE-/-:PKCθ-/- mice. E. The Ly6Chi and Ly6Clo cells were retrieved and analyzed for CD36 mRNA levels by RT-PCR or subjected to foam cell formation. F. Plasma from WD-fed ApoE-/- and ApoE-/-:PKCθ-/- mice were analyzed for cytokines levels using mouse Multi-Analyte ELISArray Kit. Data were presented as Mean ± S.D. values of three experiments *, p < 0.01 vs ApoE-/- mice (n = 6 with 3 mice per group per experiment). Scale bar is 20 μm.

