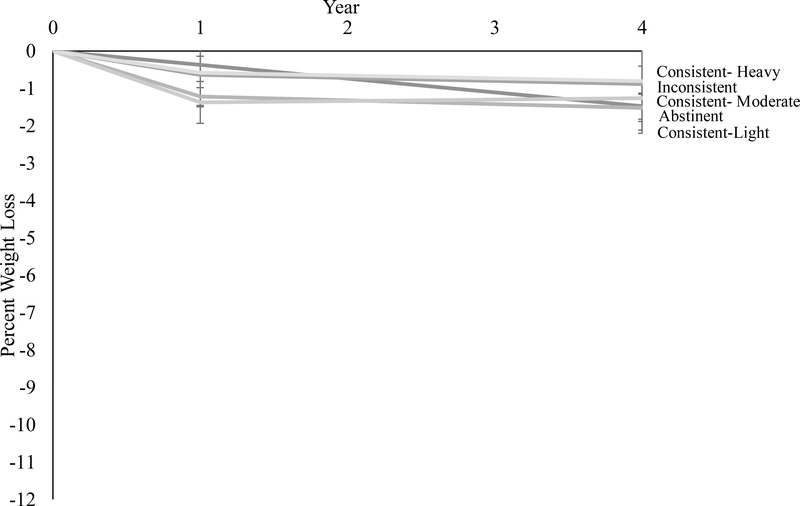
Figure 4.
Percent reduction in initial weight in the diabetes support and education group by alcohol consumption trajectory. Values shown are mean (± standard error), and weight losses were estimated using linear mixed‐effects models controlling for baseline age, race/ethnicity, gender, education, smoking status, BMI, insulin use, diabetes duration, depressive symptoms, and physical and mental health-related quality of life.

