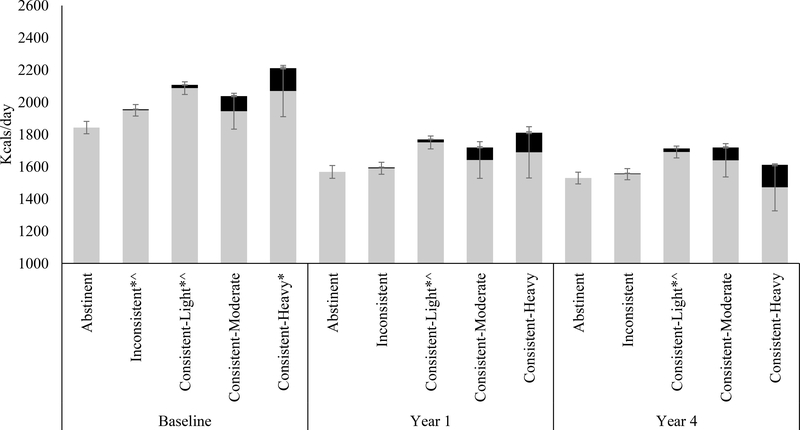
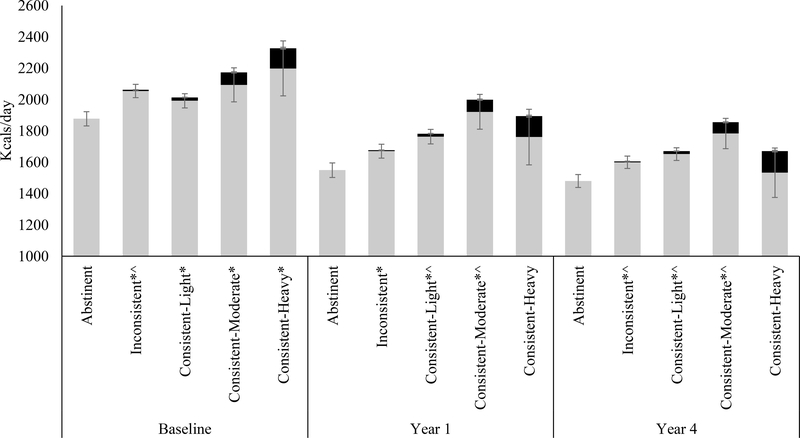
Figure 5.
Mean self-reported daily caloric intake at baseline, and years 1 and 4 based on 4-year alcohol trajectory in the (a) intensive lifestyle intervention and (b) diabetes support and education groups. Error bars represent the standard error. Grey bars represent non-alcoholic dietary intake. Black bars represent calories from alcohol. *p<0.05 for difference relative to abstinent group in total dietary intake value at baseline, year 1, or year 4. ^p<0.05 for differences relative to abstinent group in non-alcohol dietary intake. The amount of change in total dietary intake from baseline to year 1 and baseline to year 4 did not differ significantly by alcohol trajectory group (ps>0.05). ILI: Each alcohol trajectory group had significant within-group declines in dietary intake from baseline to year 1 and baseline to year 4 (ps<0.05). DSE: Each group had significant declines dietary intake from baseline to year 1 with the exception of the consistent-moderate group which was not significant for either.


