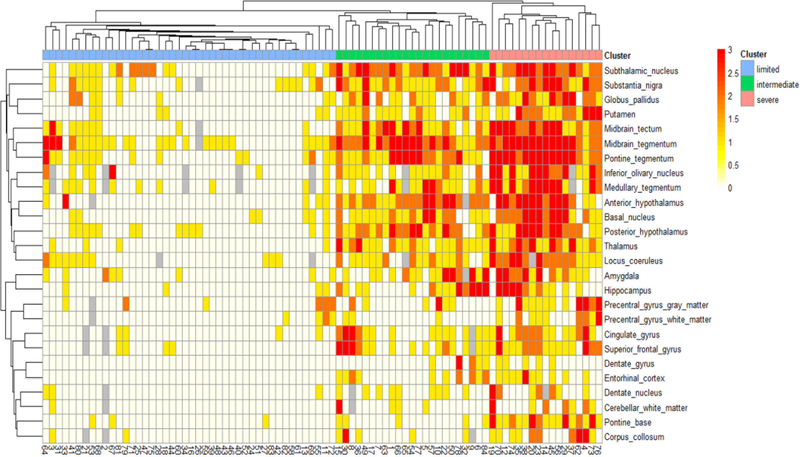
Figure 2:
Heatmap and hierarchical clustering based on TDP-43 pathology in 84 TDP-43 positive CBD cases. Three distinct clusters are identified by hierarchical clustering. The heat map reflects the severity of TDP-43 pathology, and a color scale is given at the top left. Missing data are shown in gray. Patients are represented with columns, and study ID of each patient is provided.

