
Fig 1. Development of an assay to monitor protein degradation.
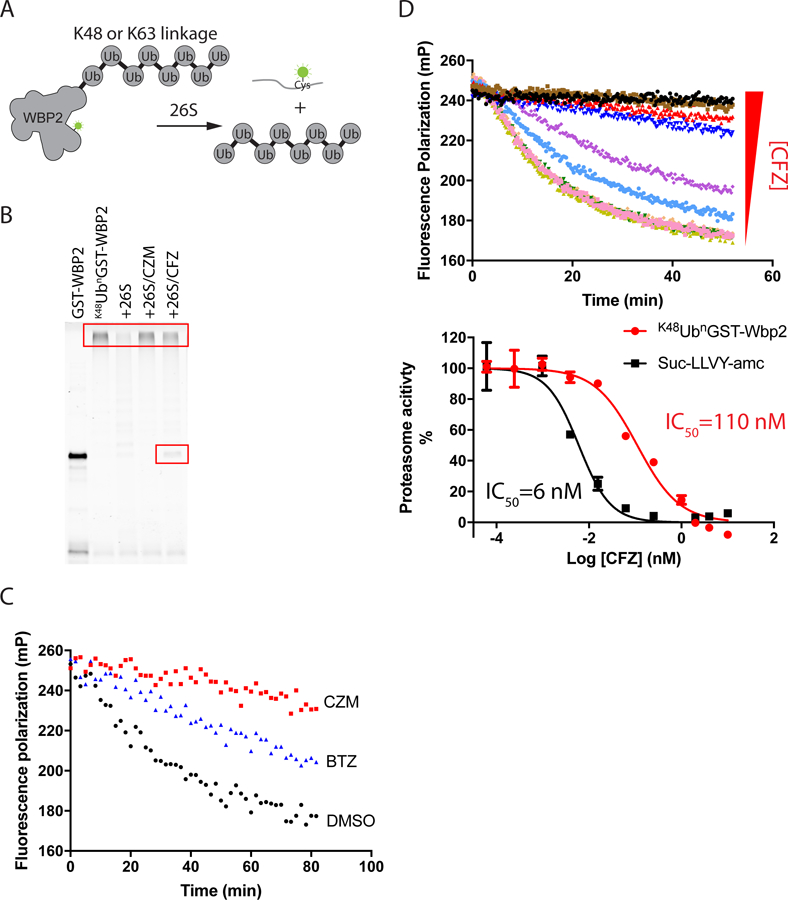
(A) Design of protein degradation assay. (B) 20 nM K48UbnGST–Wbp2 was incubated with 5 nM 26S proteasome at 37 ˚C for 2 hours in the absence and presence of different inhibitors (20 μM capzimin/CZM or 10 μM carfilzomib/CFZ). Reactions were fractionated by SDS-PAGE and analyzed using a Typhoon fluorescence scanner. Boxes mark the input high MW polyubiquitinated substrate and a deubiquitinated species that accumulated in reactions inhibited by CFZ (Verma et al., 2002). (C) Measurement of proteasome activity using the fluorescence polarization assay. K48UbnGST–Wbp2 (2.5 nM) was incubated with 26S proteasome (1 nM) at 37 °C in the absence or presence of different inhibitors (10 µM CZM or 1 µM bortezomib/BTZ). (D) Measurement of proteasome protein breakdown activity in cell lysate in response to increasing concentrations of carfilzomib. Shown are the reaction kinetics (upper panel) and dose-response (red curve in the bottom panel) of proteasome activity measured at 37 °C using K48UbnGST–Wbp2 as substrate and lysate from cells treated with different concentrations of carfilzomib. For comparison, a dose-response curve measured using Suc-LLVY-amc is plotted in black (bottom panel). Error bars represent s.d., n = 3 wells, from 1 representative of 3 independent experiments. See also Figure S1 and Table S1.