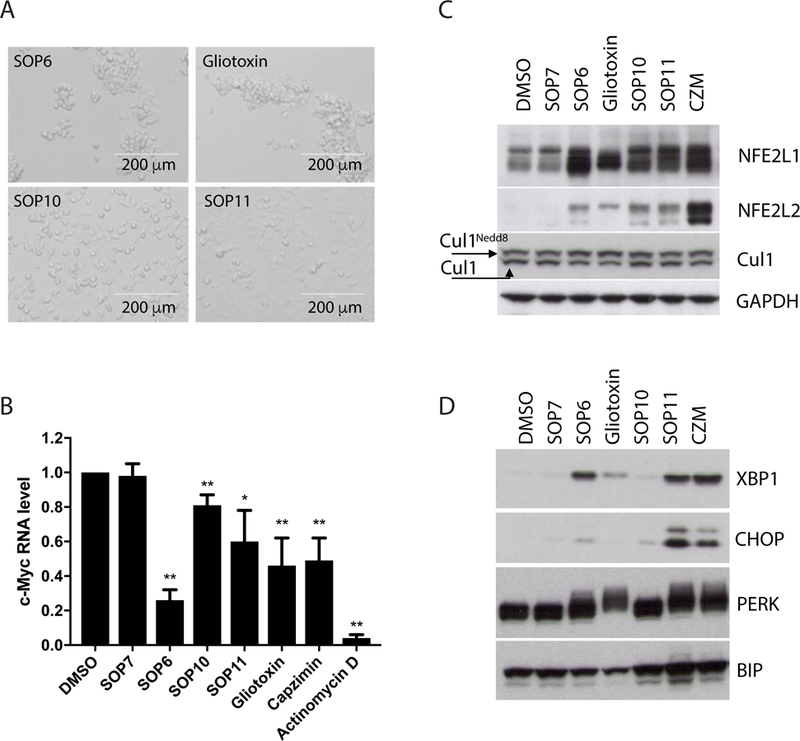
Fig 4. Cellular effects of ETPs.

(A) SOP6 and gliotoxin induce cell detachment. Shown are microscopic images of HCT116 cells, taken 3 hours after treatment with 10 μM of the indicated ETPs. Note that when the cells detach, as in the top two panels, they appear more refractile and have a tendency to clump. (B) c-Myc mRNA expression, quantified by qRT-PCR, in HCT116 cells harvested 4 hours post treatment. 1 μM actinomycin D was included as positive control, and 10 μM other compounds were used. Data are normalized to GAPDH. Error bars mean ± s.d. from three independent experiments measured in triplicate each. * P<0.05, ** P<0.01 (C) HCT116 cells were treated for 6 hours with indicated compounds, and cell lysates were fractionated by SDS–PAGE and immunoblotted with antibodies against NFE2L1, NFE2L2, Cul1 and GAPDH (loading control for C and D). (D) Same as C, except that antibodies against XBP1, CHOP, PERK and Bip were used. See also Figure S2, Figure S3 and Figure S4.
