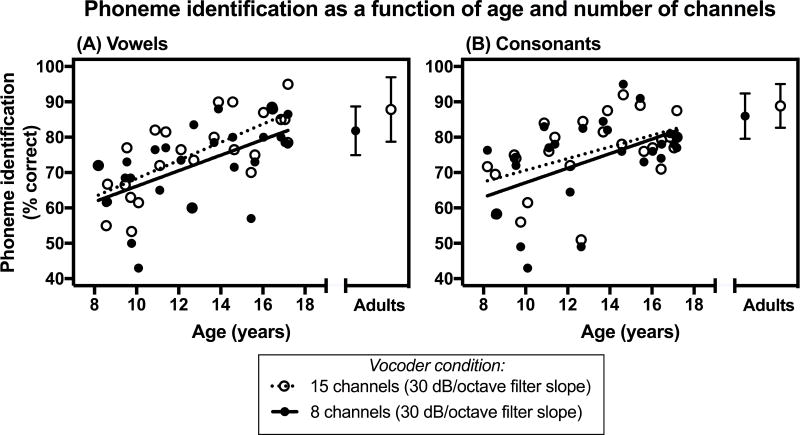
Figure 2.
Phoneme identification scores (in percent correct) as a function of chronological age and number of processing channels for children with normal hearing. Average scores for adults with normal hearing are also presented. (A) Vowel identification scores. (B) Consonant identification scores. In each panel, scores are shown for two experimental conditions that have the same filter slope (30 dB/octave), but different number of processing channels (8 channels and 15 channels). For the adult data, error bars represent ± 1 standard deviation.

