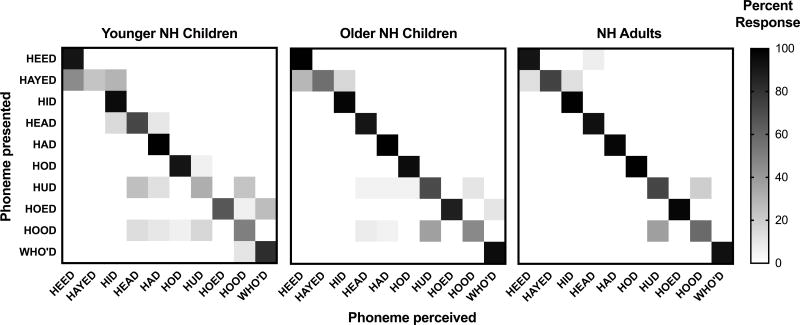
Figure 8.
Vowel confusion matrix for the 15-channel, 30 dB/octave filter slope condition for younger children with normal hearing (NH), older children with NH, and adults with NH. Percent response for each cell is indicated via a color gradient, with black representing 100% responses and white representing 0% responses. Adjacent vowels have similar formant frequencies and vowels on opposite ends of the matrix have similar first formant frequencies.

