
Figure 4.
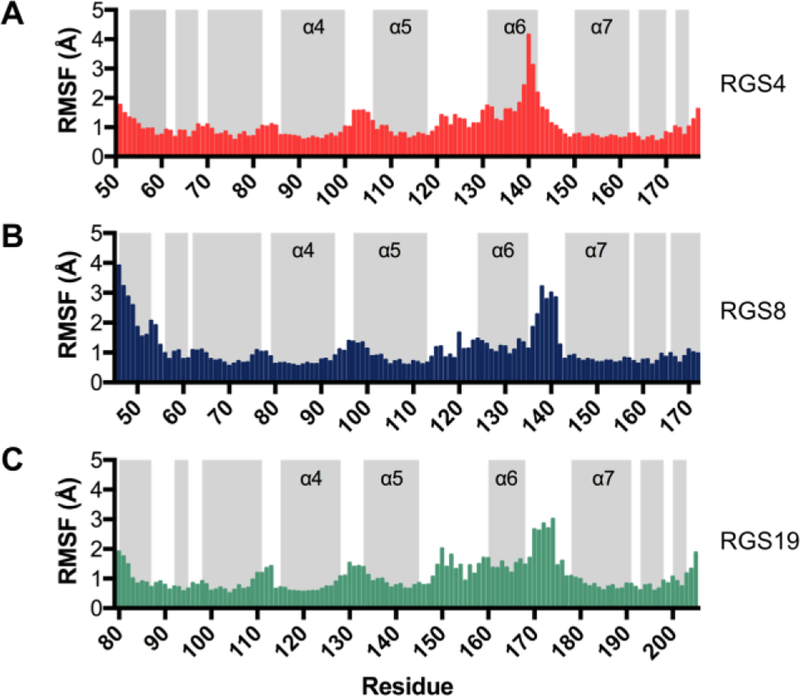
Root mean squared fluctuations (RMSF) per residue during 2-μs MD simulations of (a) RGS4 (PDB: 1AGR), (b) RGS8 (PDB: 2ODE), and (c) RGS19 (PDB: 1CMZ). The RMSF trends for each protein for the simulation set 2 are shown in Fig S2. Gray bars indicate helical regions.