
Figure 7.
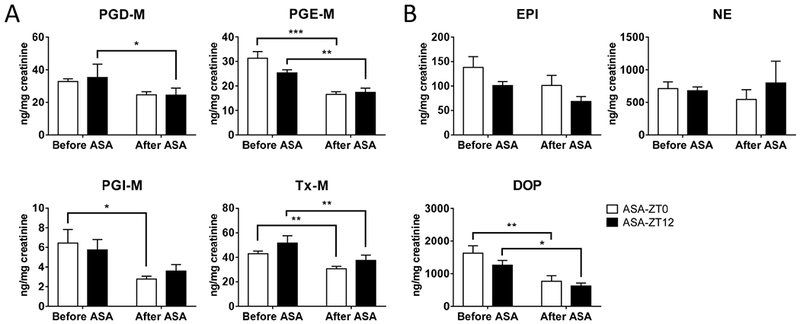
Urinary PG metabolites (A) and catecholamines (B) were measured using mass spectrometry and Elisa, respectively, (2-way ANOVA; *, p<0.05; **; p<0.01; ***, p<0.001; n=9–11). Data were normalized to creatinine.
Official websites use .gov
A
.gov website belongs to an official
government organization in the United States.
Secure .gov websites use HTTPS
A lock (
) or https:// means you've safely
connected to the .gov website. Share sensitive
information only on official, secure websites.
Urinary PG metabolites (A) and catecholamines (B) were measured using mass spectrometry and Elisa, respectively, (2-way ANOVA; *, p<0.05; **; p<0.01; ***, p<0.001; n=9–11). Data were normalized to creatinine.