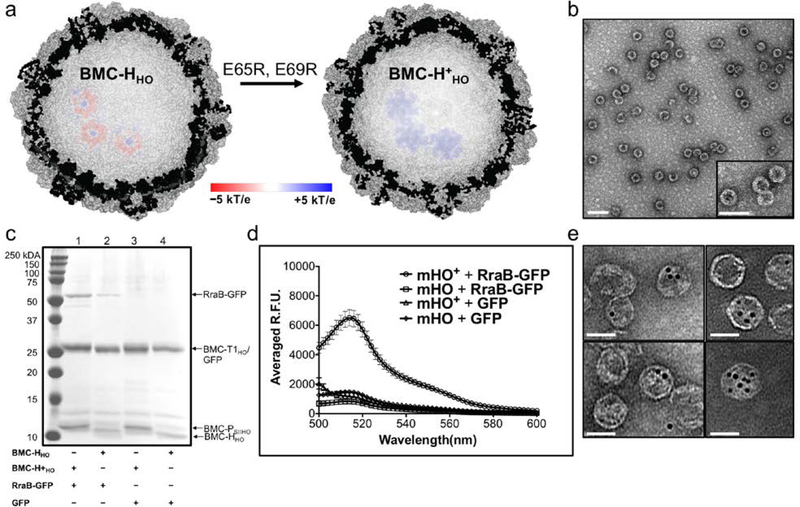
Figure 5.
Characterization of the electrostatic-based encapsulation of cargo. (a) Cutaway of the full HO shell structure (PDB ID: 5V74) incorporating the modelled electrostatic potential map of three BMC-HHO (left) and BMC-H+HO (right) hexamers. The electrostatic potential surface is colored from −5kT/e (red) to +5kT/e (blue). (b) Representative TEM image of purified mHO+ + RraB-GFP (scale bar = 100 nm). Inset is an enlarged view of the shells. See Figure S10c for a representative TEM micrograph of mHO+ + GFP (c) SDS-PAGE analysis of purified in vitro mHO/mHO+ shell assemblies with RraB-GFP or GFP. A comparable amount of protein was loaded in all the lanes, 1.2 – 1.9 μg; see Figure S11 for the DLS analysis of these assemblies. (d) Fluorescence emission spectra of purified of mHO(+) shell assemblies with RraB-GFP or GFP. The error bars in the emission spectra plots are standard deviations from the average fluorescence emission at each wavelength measured for three independent purified reactions. (e) Various TEM images of mHO+ copurified with 5 nm Au-COOH particles (scale bars = 50 nm).

