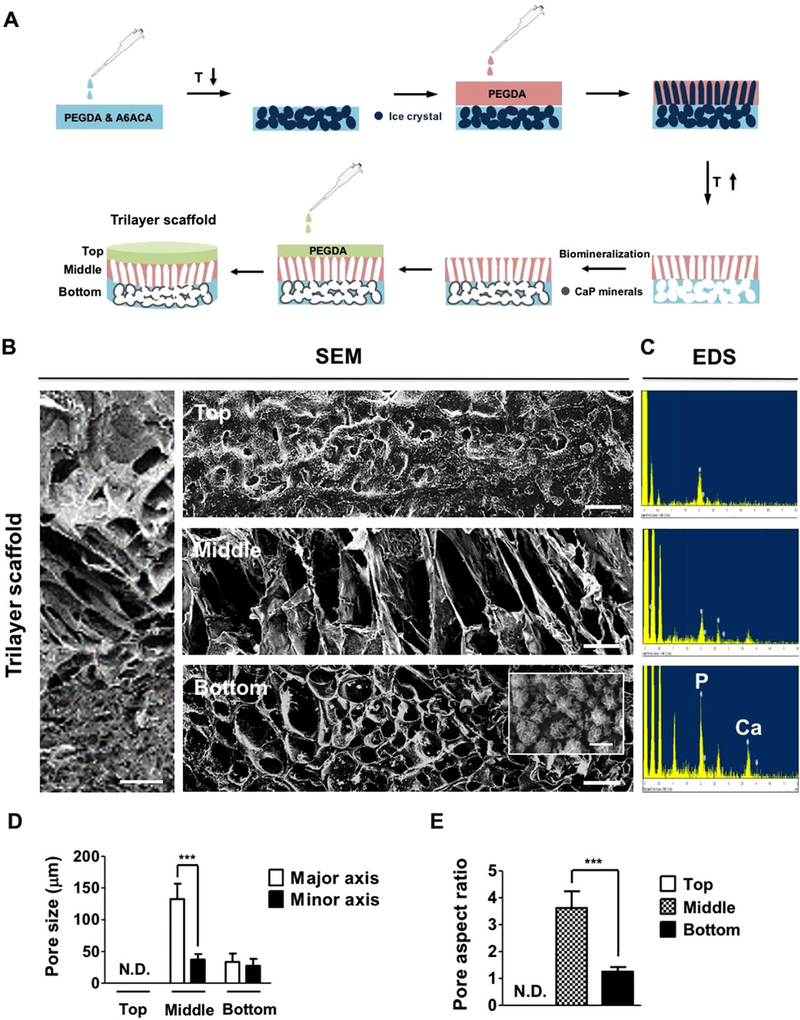
Fig. 1.
Trilayer scaffold exhibits layer-dependent varying pore microstructure and CaP biominerals. (A) Schematic for stepwise synthesis of the trilayer scaffold. (B) Scanning electron microscopy (SEM) image for cross-section of the trilayer scaffold. Scale bar represents 200 µm. High magnification SEM images of top, middle, and bottom layers of the trilayer scaffold are also shown. Scale bars indicate 50 µm. Inset shows a close-up SEM image of CaP biominerals in the bottom layer of the trilayer scaffold. Scale bar represents 2 µm. (C) Energy dispersive spectra (EDS) of top, middle, and bottom layers of the trilayer scaffold. (D) Pore size in major and minor axes as well as (E) pore aspect ratio calculated from SEM images of top, middle, and bottom layers of the trilayer scaffold. N.D. indicates non-detectable pores from the top layer of the trilayer scaffold. The data are presented as mean ± standard deviations (n = 30). Two-tailed Student’s t-test was used to compare two groups. Asterisks indicate statistical significances according to p-values (***p < 0.001).

