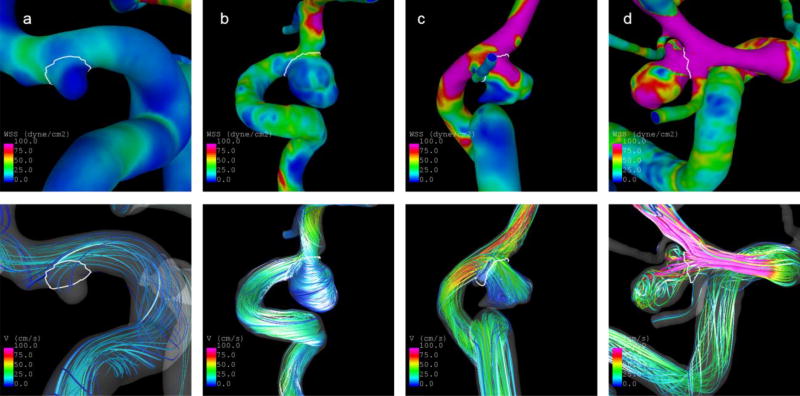
Fig. 5.
Illustration of cases with low (a–b) and high (c–d) predicted probabilities of being ruptured based on Model 1. Top panel: WSS distribution at half of the cardiac cycle. Bottom panel: Blood flow velocities at half of the cardiac cycle. The predicted probabilities and selected aneurysm characteristics are shown in Tab. 3

