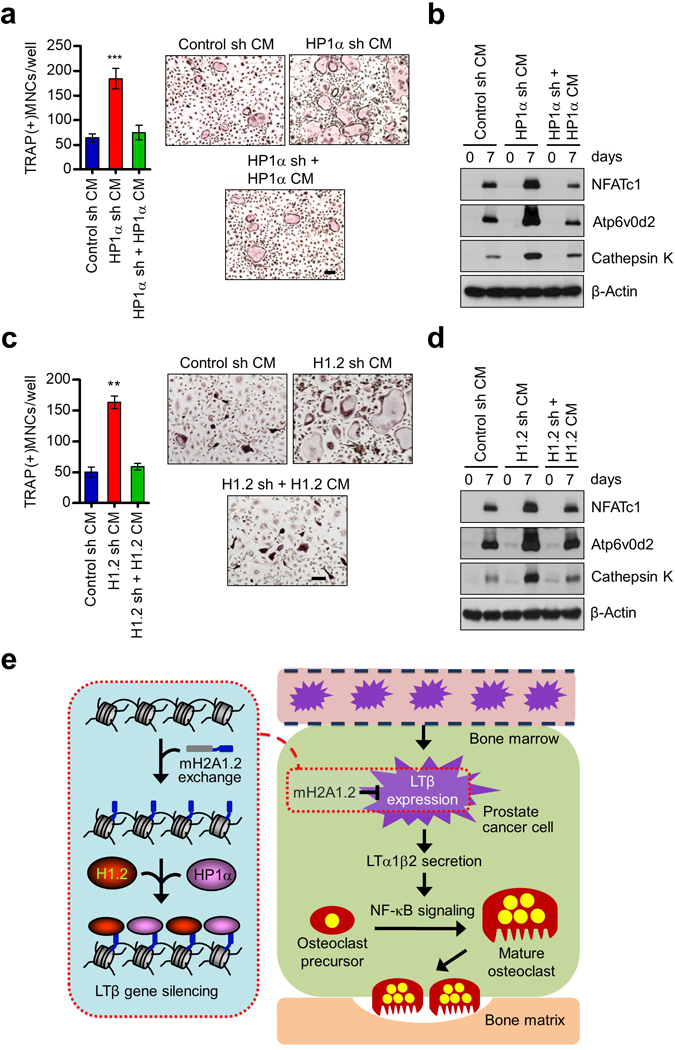
Figure 7.

Inhibition of osteoclastogenesis by HP1α and H1.2. (a) OCP cells were treated with CMs from HP1α-depleted DU145 prostate cancer cells in the presence of RANKL, and stained for TRAP. HP1α-depleted cells were infected with lentiviruses expressing HP1α, and their CMs were also analyzed for osteoclastogenic activity. Scale bar, 100 μm. (b) Expression levels of osteoclast marker genes (NFATc1, Atp6v0d2 and Cathepsin K) in OCP cells treated with indicated CMs were analyzed by Western blot. β-Actin was used as a loading control. (c) CMs were harvested from mock-depleted or H1.2-depleted DU145 cells expressing shRNA-resistant H1.2 and analyzed for RANKL-induced osteoclastogenesis. Scale bar, 100 μm. (d) Western blot analyses of three osteoclast marker genes after treating OCP cells with indicated CMs for 0 and 7 days. β-Actin was used as a loading control. (e) A model for how mH2A1.2 might affect prostate cancer-induced osteoclast differentiation. See Discussion for details. Error bars in (a, c) denote the means ± s.d. from triplicate wells; **P<0.01, ***P<0.001 versus Control sh CM (ANOVA analysis).
