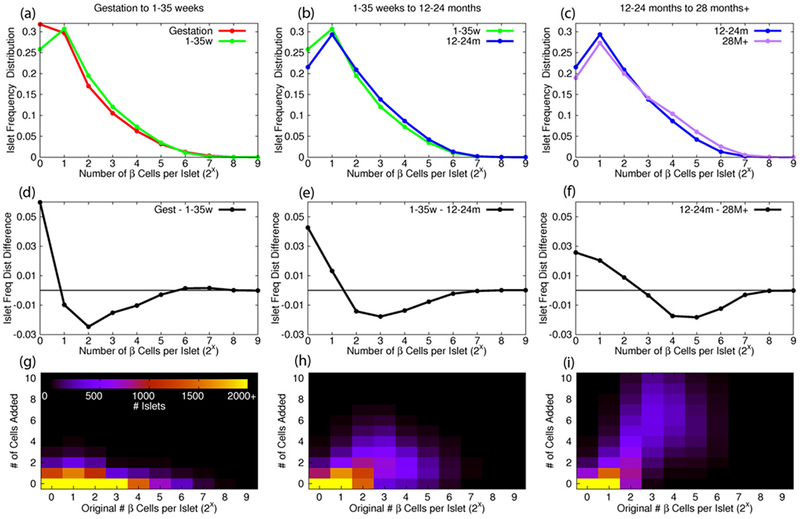
Figure 3.

Simulation step representing increase in β cell count per islet observed between developmental stages. Islet graphs for vertex addition were chosen based on differences ((d)–(f)) in the distribution ((a)–(c)) of islets with respect to β cell count from developmental stage to stage. (g)–(i) After running all simulations, the number vertices added to islets of a given size were averaged over all simulations per transition.
