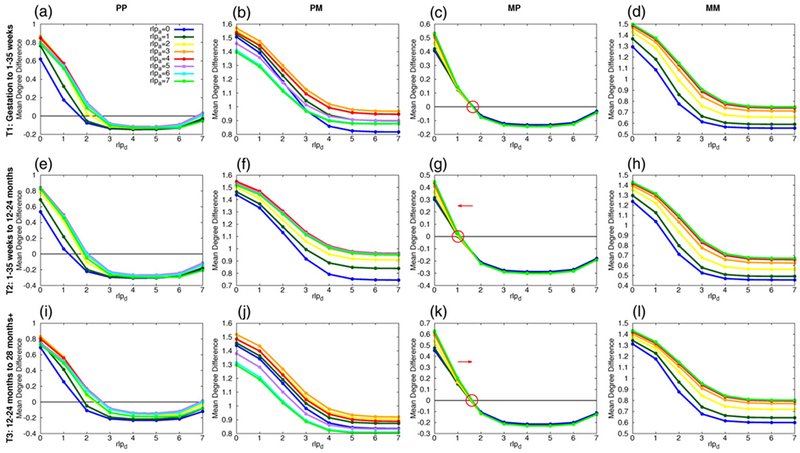
Figure 7.

Results from ββ graph transition simulations illustrate possible (addition, deletion) processes for producing the next developmental stage’s architecture. (a)–(f) The difference in mean degree between the resulting ββ graph simulation and that of the next developmental stage for each process, (PP (column 1), PM (column 2), MP (column 3) and MM (column 4)) and each developmental transition (gestation to 1–35 weeks (row 1), 1–35 weeks to 12–24 months (row 2), 12–24 months to 28 months+ (row 3)). Each point represents a given (rlpa, rlpd) pair. Measure equilibria are found for each developmental transition for the PP an MP processes.
