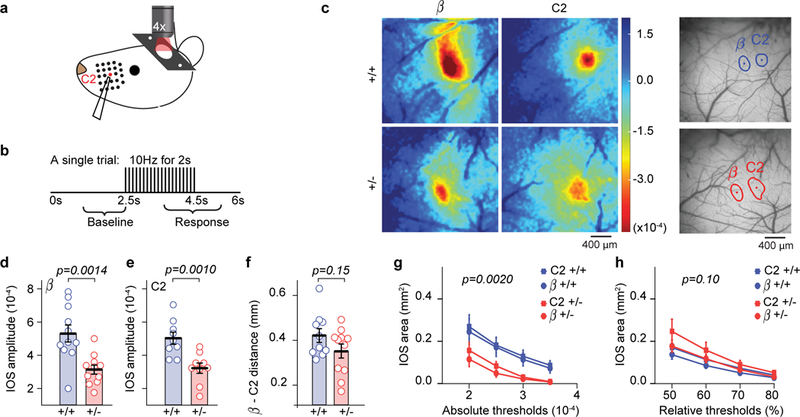
Figure 1: Reduced sensory-evoked brain activity in Syngap1 SSC.

(a-b) Stimulus paradigm used during IOS imaging. (c) Example IOS signals from one animal in each genotype obtained for β and C2 whiskers. (d-f) Scatter plots showing reduced IOS amplitudes in β (d) and C2 (e) whisker fields, but normal inter-barrel distance (f) in adult Syngap1 mutants. Unpaired two-sided t-Tests: t(20)=3.76 p=0.0014 for β amplitude (n=11 WT n=11 Het mice), t(16)=3.70 p=0.001 for C2 amplitude (n=9 WT, n=9 Het mice), t(19)=1.49 p=0.15 for inter-barrel distance(n=10 WT n=11 Het mice). (g, h) Quantification of the area responding to β or C2 whisker stimulation according to absolute (g) or relative thresholding methods (h). 2-way RM-ANOVA for absolute area F(1,36)=11.18 p=0.002 for genotype, F(3,108)=1.74 p=0.163 for genotype*threshold; 2-way RM-ANOVA for relative area F(1,36)=2.8 p=0.1 for genotype, F(3,108)=2.92 p=0.037 for genotype*threshold (n=20 WT n=20 Het IOS imaging sessions from different whiskers). For d-f, open circles represent animal means, black lines indicate population means and error bars indicate SEMs. For g-h, closed circles and squares represent population means and error bars indicate SEMs. Data in this figure were acquired from two independent cohorts of animals that were pooled together.
