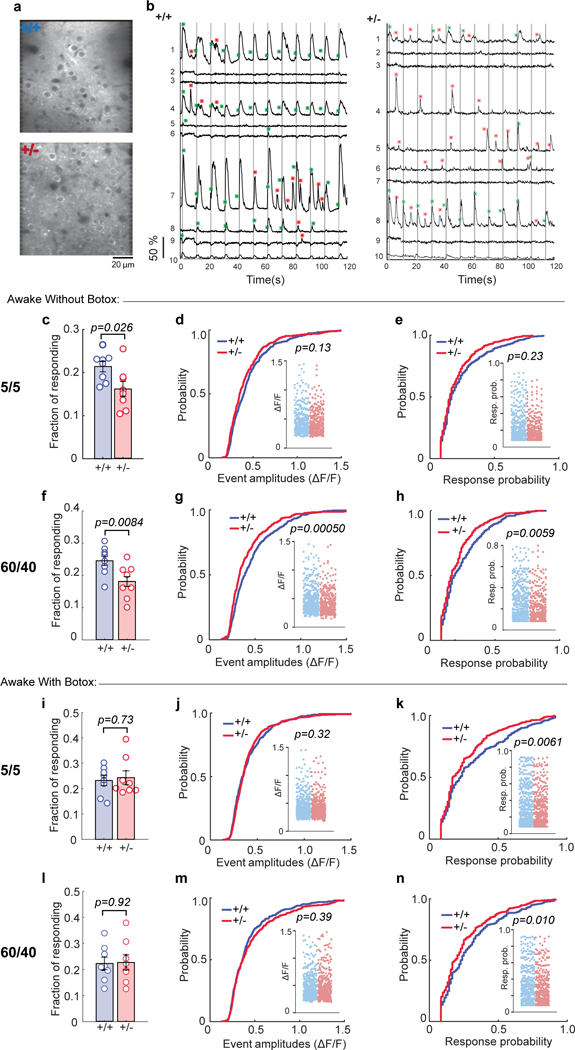
Figure 3: Reduced whisker responsiveness of SSC neurons in behaving Syngap1 mice.

Representative in vivo two-photon microscopy images (a) and representative ΔF/F traces (b) of 9 (1-9) neurons in WT and Het (Botox-) mice in response to 5 passive whisker deflections at 5 Hz. Gray vertical lines indicate the timing of whisker stimuli. Green asterisks indicate calcium events within the response detection window. Red asterisks show spontaneous calcium events. ROI number 10 is the neuropil signal. (c-h) Cellular sensory properties from awake animals in response to 5 pulses at 5 Hz (c-e) and 60 pulses at 40 Hz whisker stimulation (f-h). (c) Scatter plot showing fraction of responding cells in WT and Het mice (Unpaired t-test t(14)=2.48, p=0.026; WT n=8 mice, Het n=8 mice). (d-e) Cumulative probability and scatter plots (inserts) of ΔF/F amplitudes (d, KS Test, p=0.13; WT: n=406 neurons, Het: n=330 neurons) and response probabilities (e, KS Test, p=0.23) in responding neurons. (f) Scatter plot depicting fraction of responding cells in WT and Het mice (Unpaired t-test t(14)=3.07, p=0.0084; WT n=8 mice, Het n=8 mice). (g, h) Cumulative probability and scatter plots (inserts) of ΔF/F amplitudes (g, KS Test, p=0.00050; WT: n=467 neurons, Het: n=368 neurons) and response probabilities (h, KS Test, p=0.0059) in responding neurons. (i-n) Cellular sensory properties from awake animals following Botox injection in response to 5 pulses at 5 Hz (i-k) and 60 pulses at 40 Hz whisker stimulation (l-n). (i) Scatter plot depicting fraction of responding cells in WT and Het mice (Unpaired t-test t(14)=0.35, p=0.73; WT n=8 mice, Het n=8 mice). (j, k) Cumulative probability and scatter plots (inserts) of ΔF/F amplitudes (j, KS test, p=0.32; WT: n=413 neurons, Het: n=416 neurons) and response probabilities (k, KS Test, p=0.0061) in responding neurons. (l) Scatter plot showing fraction of responding cells in WT and Het mice (Unpaired t-test t(14)=0.11, p=0.92; WT n=8 mice, Het n=8 mice). (m, n) Cumulative probability and scatter plots (inserts) of ΔF/F amplitudes (m, KS Test, p=0.39; WT: n=481 neurons, Het: n=445 neurons) and response probabilities (n, KS Test, p=0.010) in responding neurons. (c-h) Data obtained from 1921 neurons in 54 imaging planes from 8 WT mice; 2044 neurons in 54 imaging planes from 8 Het mice. (c-n) Data was pooled from two independent cohorts of animals and thus obtained from 2169 neurons in 56 imaging planes from 8 WT mice; 1971 neurons in 55 imaging planes from 8 Het mice. In scatter plots, open circles are animal means, closed circles are individual cells, black lines indicate population means, and error bars indicate SEMs. All statistical tests were two-sided.
