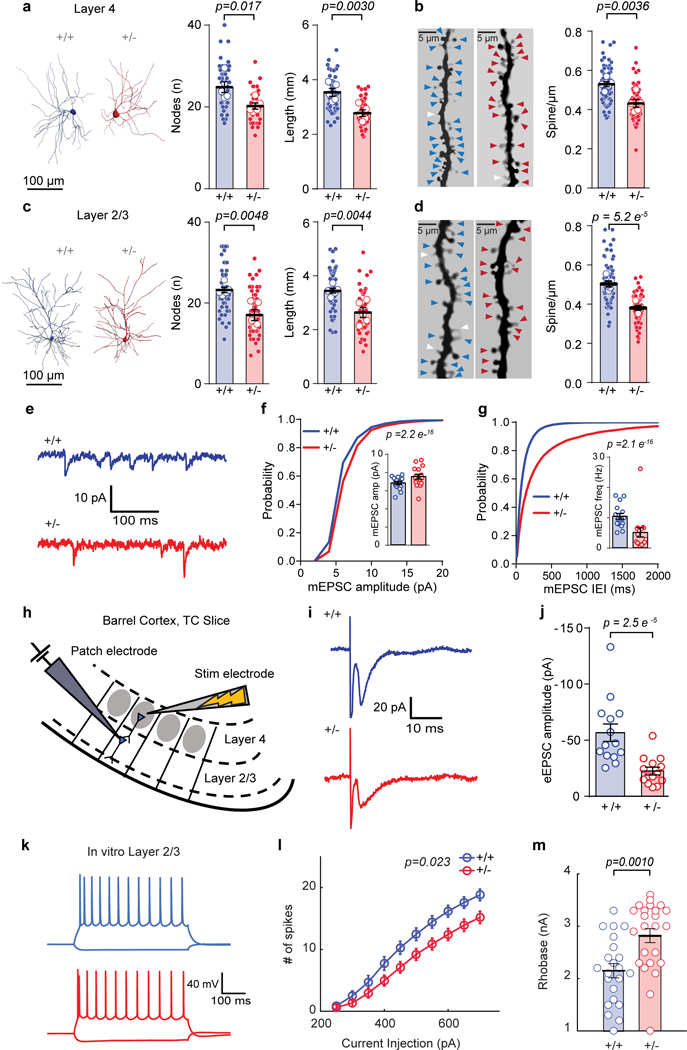
Figure 7: Syngap1 heterozygosity degrades synaptic connectivity and reduces intrinsic excitability of upper layer SSC neurons.

(a, c) Representative 3D reconstruction of L4 (a, left) and L2/3 (c, left) of SSC excitatory neurons depicting dendritic complexity and scatter plot (right) showing the total length and # of nodes by using Sholl analysis. (a) Total length: (WT = 5 mice, Het = 5 mice), unpaired t-Test, t(8)=4.002, p = 0.0030; # of Nodes: unpaired t-Test, t(8)=3.017, p = 0.0166. (c) Total length: (WT = 5 mice, Het = 6 mice), unpaired t-Test, t(9)=3.7713, p = 0.0044; # of Nodes: unpaired t-Test, t(9)=3.7090, p = 0.0048, from a single cohort of animals. (b, d) Examples of L4 (b, left) and L2/3 (d, left) apical dendrites and scatter plots (right) depicting the density of dendritic spines. (b) Layer 4 - spine density: (WT = 5 mice, Het = 5 mice), unpaired t-Test, t(8)=4.059, p = 0.0036. (d) Layer 2/3 - spine density: (WT = 5 mice, Het = 5 mice), unpaired t-Test, t(8)=7.80, p = 5.2E-5, from a single cohort of animals. (e) Representative traces depicting L2/3 excitatory neuron mEPSCs from acute WT and Het TC slices. (f, g) Cumulative probability and scatter plots (inserts) of mEPSC amplitudes (f, Kolmogorov-Smirnov test p= 2.2E-16) and mEPSC IEI (g, Kolmogorov-Smirnov test p= 2.1E-16). (f, g) Data was acquired from a single cohort of animals with n=7986 mEPSC events from16 neurons in 4 WT and n=6765 mEPSC events from 16 neurons in 4 Het mice. (h) Cartoon depicting experimental setup for investigating feed-forward excitation in L2/3 excitatory neurons from L4. (i) Representative traces depicting L2/3 excitatory neuron eEPSCs from acute WT and Het TC slices. (j) Scatter plot of eEPSC amplitudes in L2/3 following stimulation of L4 (Mann-Whitney test, U=14.00, p= 2.5E-5; Data obtained from a single cohort of animals; WT n=14 neurons from 4 mice, Het n=14 neurons from 4 mice). (k) Representative current-clamp traces from L2/3 excitatory neurons from acute WT and Het TC slices and (l) graph depicting a decrease in the number of spikes (2-way RM-ANOVA, F(1,46)=5.51, p=0.023 for genotype effect F(9,414)=5.46, 9.0E-9 for genotype and stimulus interaction, n=22 neurons from 5 WT mice, n=26 neurons from 6 Het mice) in response to current injections. (m) Scatter plot showing increased rheobase (Student’s t-test: t(44)=3.50, p = 0.0010) in the same set of neurons as in l. Data was obtained from a single cohort of animals. For morphology data, open circles are animal means, closed circles are individual cells, black lines indicate population means, error bars indicate SEMs, colored triangles represent spines (blue = WT, red = Het) and white triangles represent filopodia. For f, g, j, m, open circles are individual cells, black lines indicate population means, and error bars indicate SEMs. For l, circles represent population means and error bars indicate SEMs. All statistical tests were two-sided.
