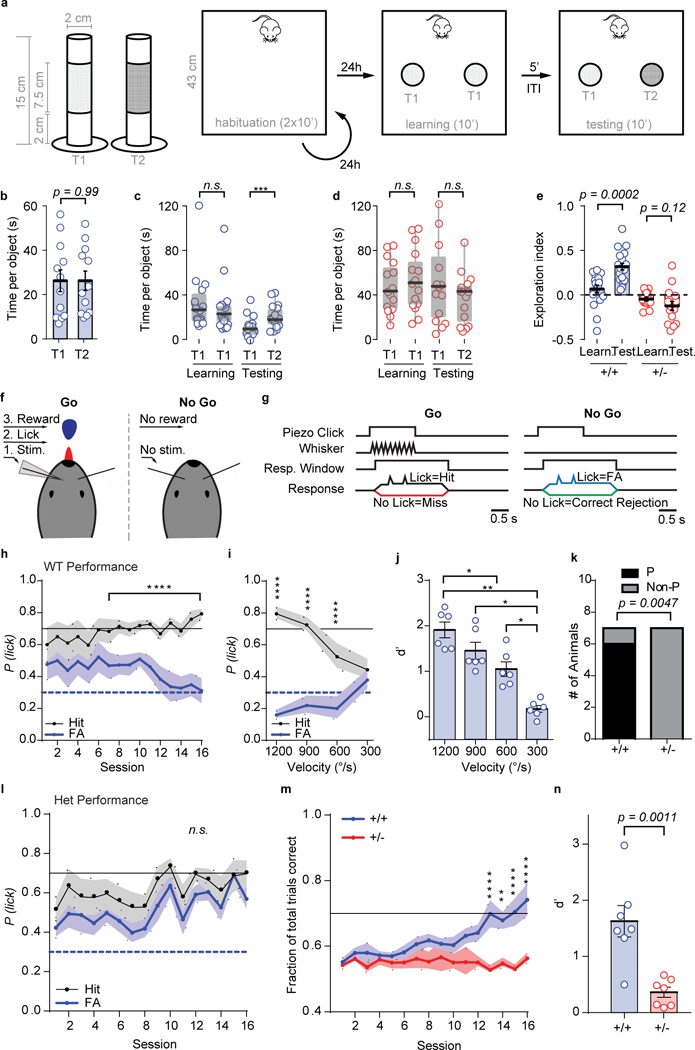
Figure 8: Impaired texture discrimination and whisker-dependent Go/NoGo task performance in Syngap1 mice.

(a) Cartoons depicting different texture roughness of the objects used in Novel Texture Discrimination Task and relative protocol. (b) Scatter plot showing no preference in exploring T1 or T2. (T1 vs T2: n = 12 mice; unpaired t-Test, t(22) = 0.0016, p = 0.9986. (c-d) Box plots (solid line represents median, box represents interquartile range and whiskers represent maximum and minimum values) depicting time spent exploring identical textured objects during the learning phase and time spent exploring the novel (T2) and the old (T1) object for WT (c) and Het groups (d) [(WT mice Friedman test: χ2 (n = 18 mice, df = 3) = 28.87, exact sign. p = 1.4206 E-7; (HET mice, Friedman test: χ2 (n = 15 mice, df = 3) = 15.24, exact sign. p = 0.0016). Pairwise comparisons: (WT(learning) vs WT(testing), Sign test: n = 18 mice, Z = 4.007 p = 0.00006; HET(learning) vs HET(testing), Sign test: n = 15 mice, Z = 2.065, p = 0.04, ns). Statistical significance was accepted at the p < 0.03125. WT(learning) vs HET(learning), Mann-Whitney U test: Z = −2.567 p = 0.01; WT(testing) vs HET(testing), Mann-Whitney U test: Z = −2.821 p = 0.0048). (e) Scatter plot showing Exploration Index for animals in c and d: WT mice, paired t-Test: t(17) = 4.707, p = 0.0002; HET mice paired t-Test: t(14) = 1.641, p = 0.123; One sample test: WT(learning), t(17) = 1.555, p = 0.138; WT(testing), t(17) = 8.579, p = 1.39E-7; HET(learning), t(14) = −2.164, p = 0.048, ns; HET(testing), t(14) = −2.415, p = 0.03, ns. (f) Cartoon representation of Go/NoGo setup. Water-restricted, head-fixed mice were rewarded with water for licking a lick-port in response to a passive whisker (C2) deflection. (g) Detection task trial structure for Step 2 training. Go trials are identical to NoGo trials, except for the passive whisker deflection. Note, NoGo trials include activation of a “dummy piezo” not attached to any whisker to control for noise/vibration associated with piezo activation. (h) Step 2 training learning curve for WT mice showing the probability of licking (P(lick)) on Go (black, hit) or NoGo (blue, FA) trials (n=7 mice; 2-way RM-ANOVA with Bonferroni’s multiple comparison, Trial type: F(1,6)=67.19 p= 0.0002; Session: F(15,90)=0.4827 p=0.9437; Trial type*Session interaction F(15,90)=5.86 p= 2.9E-8). (i, j) Reductions in angular velocity of whisker deflections impairs the ability of “Good Performing” WT mice to discriminate between trial types (i: n=6 mice; 2-way RM-ANOVA with Bonferroni’s multiple comparison, Trial type: F(1,5)=471.1 p= 3.9E-6; Velocity: F(3,15)=1.469 p=0.263; Trial type*Velocity interaction: F(3,15)=30.12 p= 1.4E-6) and results in a reduced discrimination index (j: n=6 mice; RM-ANOVA with Bonferroni’s multiple comparison, F(3,15)=24.52 p= 4.9E-6). (k) Proportion of mice to learn (performers, P vs. non-performers, Non-P) the task (WT n=7, Het n=7: Fisher’s Exact Test: p=0.0047). (l) Step 2 training learning curve for Het mice (n=7 mice; 2-way RM-ANOVA with Bonferroni’s multiple comparison, Trial type: F(1,6)=8.44 p=0.027; Session: F(15,90)=2.416 p=0.0054; Trial type*Session interaction F(15,90)=0.8852 p=0.5825). (m) Learning curves depicting the fraction of total trials correct in Step 2 training (WT n=7, Het n=7; 2-way RM-ANOVA with Bonferroni’s multiple comparison, Genotype: F(1,12)=10.13 p=0.0079; Session: F(15,180)=3.665 p= 1.4E-5; Genotype*Session interaction: F(15,180)=4.398 p= 5.2E-7). (n) Scatter plot showing the discrimination index at the completion of Step 2 training (WT n=7, Het n=7; Unpaired t-test, t(12) = 4.281, p=0.0011). Data for both Novel Texture Discrimination and Go/NoGo Tasks were obtained from two independent cohorts of animals. Open circles are individual animals, closed circles and solid black horizontal lines indicate population means and error bars or shaded area represent the SEMs, except for boxplots in c and d which are described above. *P<0.05, **P<0.01, ***P<0.001, ****P<0.0001 for post-hoc multiple comparisons. (h, i, l) Solid black and blue dashed lines indicate performance criteria for hit and FAs, respectively. (m) Solid black line indicates performance criteria for total trials correct. All statistical tests were two-sided.
