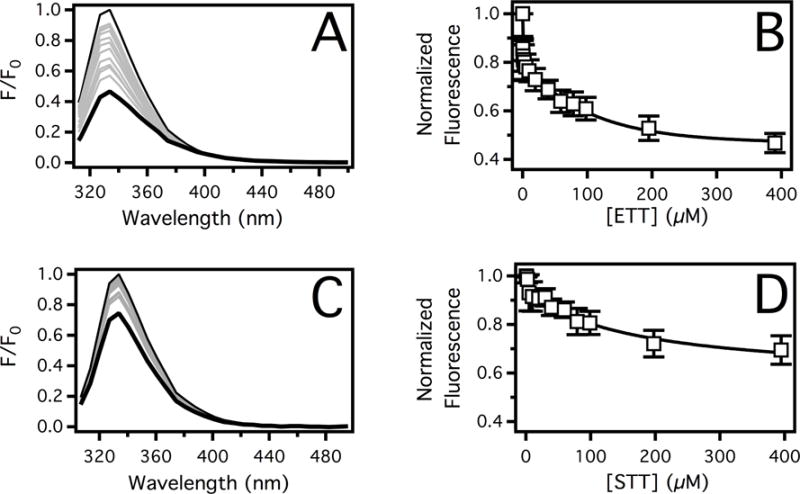
Figure 3.

The affinity of ETT and STT to Pgp deduced by protein fluorescence spectroscopy. Pgp fluorescence emission spectra in the presence of a range of (A) ETT and (C) STT concentrations. The fluorescence emission spectrum at 0 μM and 400 μM triptan drugs are shown as thin and thick black lines, respectively. Spectra at intermediate concentrations are shown in gray. The corrected fluorescence emission amplitude at 330 nm was plotted as a function of (B) ETT and (D) STT concentration. The points and error bars represent the average and standard deviations, respectively, of at least three independent experiments.
