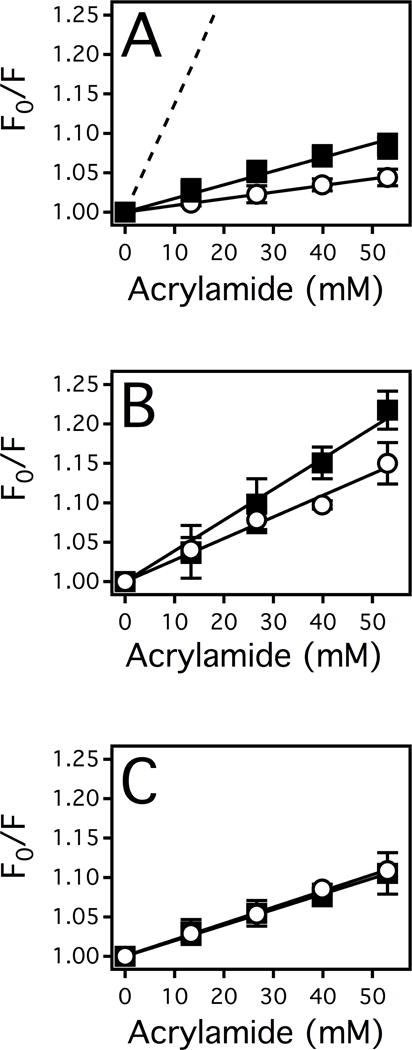
Figure 5. ETT and STT induced conformational changes of Pgp in the absence and presence of an ATP analog AMPPNP inferred by fluorescence spectroscopy.

(A) The Stern-Volmer plots of NATA (dashed line), Pgp in the absence of drugs (closed squares) and in the presence of AMPPNP (open circles). (B) The Stern-Volmer plot of Pgp in the presence of STT (closed squares) and STT with AMPPNP (open circles). (C) The Stern-Volmer plot of Pgp in the presence of ETT (closed squares) and ETT with AMPPNP (open circles). The points represent the average and the error bars represent the standard deviation of at least three independent experiments.
