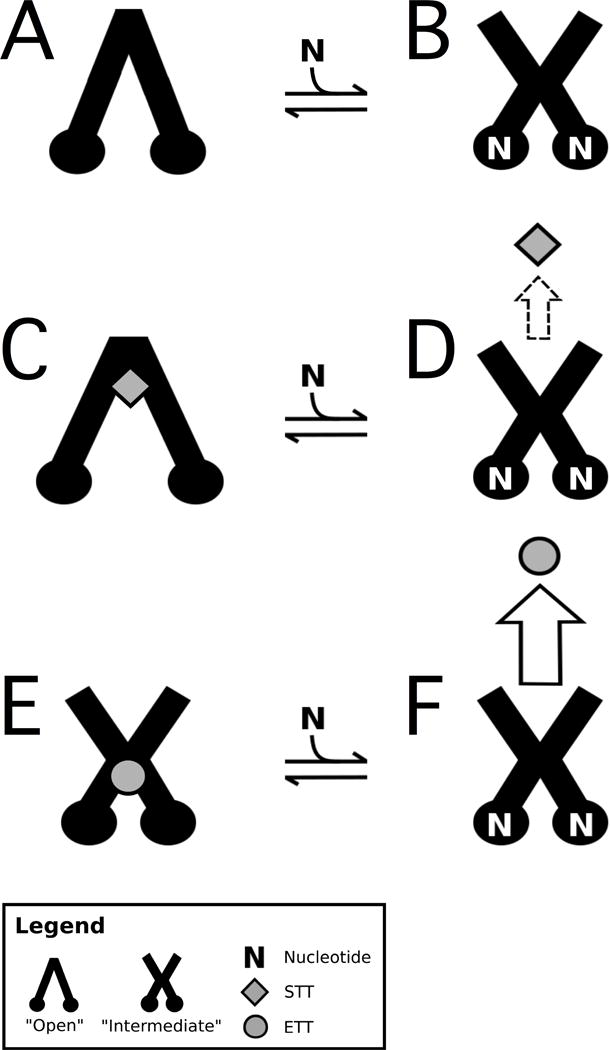
Figure 6. Conformationally gated model of triptan transport by Pgp.

Pgp is depicted as a cartoon image of the “open” and “intermediate” states in the (A,B) absence of drug, the presence of (C,D) STT and (E,F) ETT. STT are shown as gray diamonds, ETT are gray circles and N is ATP. The horizontal arrows represent equilibrium between the nucleotide-bound conformational states of Pgp. The sizes of the vertical arrows represent the degree of transport. The dashed arrow reflects the fact that STT has been observed to be both transported19 and not transported by Pgp1 depending on the cell type.
