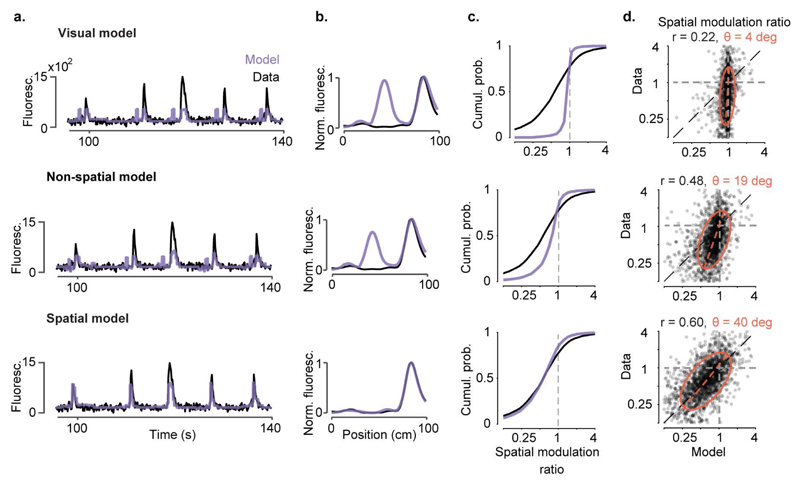
Extended Data Figure 7. Observed values of spatial modulation ratio can only be modelled using spatial position.
a-b, We constructed three models to predict the activity of individual V1 neurons from successively larger sets of predictor variables. In the simplest, the ‘visual’ model, activity is required to depend only on the visual scene visible from the mouse’s current location, and is thus constrained to be a function of space that repeats in the visually matching section of the corridor. The second ‘non-spatial’ model also includes modulation by behavioural factors that can differ within and across trials: speed, reward times, pupil size, and eye position. Because these variables can differ between the first and second halves of the track, modelled responses need no longer be exactly symmetrical; however, this model does not explicitly use space as a predictor. The final ‘spatial’ model extends the previous model by also allowing responses to the two matching segments to vary in amplitude, thereby explicitly including space as a predictor. Example single-trial predictions are shown as a function of time in (a), together with measured fluorescence. Spatial profiles derived from these predictions are shown in (b).
c, Cumulative distributions of spatial modulation ratio for the three models (purple curves). For comparison, the black curve shows ratio of peaks derived from the data (even trials) (median ± m.a.d: visual model: 0.99 ± 0.03; two-sided Wilcoxon rank sum test: p < 10-40, non-spatial model: 0.83 ± 0.18; p < 10-40; spatial model: 0.60 ± 0.27; p = 0.09, n = 2,422 neurons)
d, Measured spatial modulation ratio versus prediction of the 3 models. Each point represents a cell; red ellipse represents best fit Gaussian, dotted line measures its slope. The purely visual model (top) does poorly, and is only slightly improved by adding predictions from speed, reward, pupil size, and eye position (middle). Adding an explicit prediction from space provides a much better match to the data (bottom). r: Pearson’s correlation coefficient, n = 2,422 neurons; θ: orientation of the major axis of the fitted ellipsoid.

