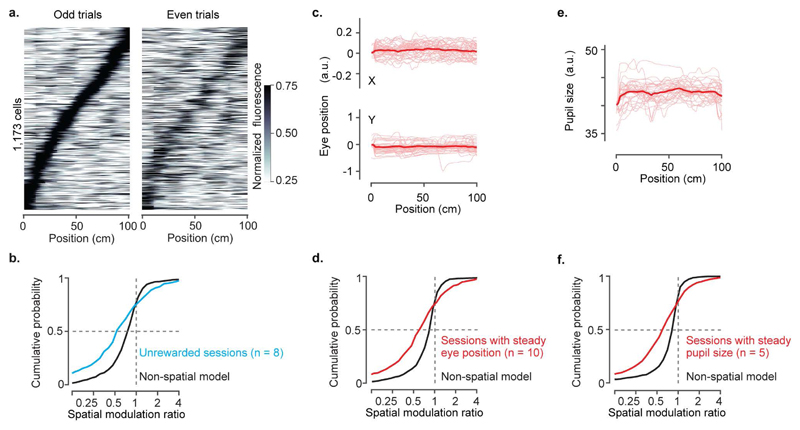
Extended Data Figure 6. The spatial modulation of V1 responses cannot be explained by reward, pupil position or diameter.
a, Normalised response as a function of position in the virtual corridor, for sessions without reward (1,173 cells). Data come from 2 out of 4 mice that ran the environment without reward (8 sessions, 2 mice). Responses in even trials (right) are ordered according to the position of maximum activity measured in odd trials (left).
b, Distribution of spatial modulation ratio for unrewarded sessions (8 sessions; median ± m.a.d.: 0.57 ± 0.37; cyan) and for modelled ratios obtained from the ‘non-spatial’ model on the same sessions (black). The two distributions are significantly different (two-sided Wilcoxon rank sum test; p<10-8).
c, Pupil position as a function of location in the virtual corridor, for an example session with steady eye position. Sessions with steady eye positions were defined as those with no significant difference in eye positions between visually matching positions 40 cm apart (with unpaired t-test p < 0.01). Thin red curves: position trajectories on individual trials; thick curves, average. Top and bottom panels: x- and y-coordinates of the pupil.
d, Distribution of spatial modulation ratio for sessions with steady eye position (10 sessions; median ± m.a.d.: 0.63 ± 0.33; red) and for modelled ratios obtained from the ‘non-spatial’ model on the same sessions (black). The two distributions are significantly different (two-sided Wilcoxon rank sum test; p<10-14).
e, Pupil size as a function of position for an example session with steady pupil size.
f, Distribution of spatial modulation ratio for sessions with steady pupil size (5 sessions; median ± m.a.d.: 0.63 ± 0.33; red) and for modelled ratios obtained from the ‘non-spatial’ model on the same sessions (black). The two distributions are significantly different (two-sided Wilcoxon rank sum test; p<10-13).

