
Fig. 3. RRSP residues that contribute to KRAS processing.
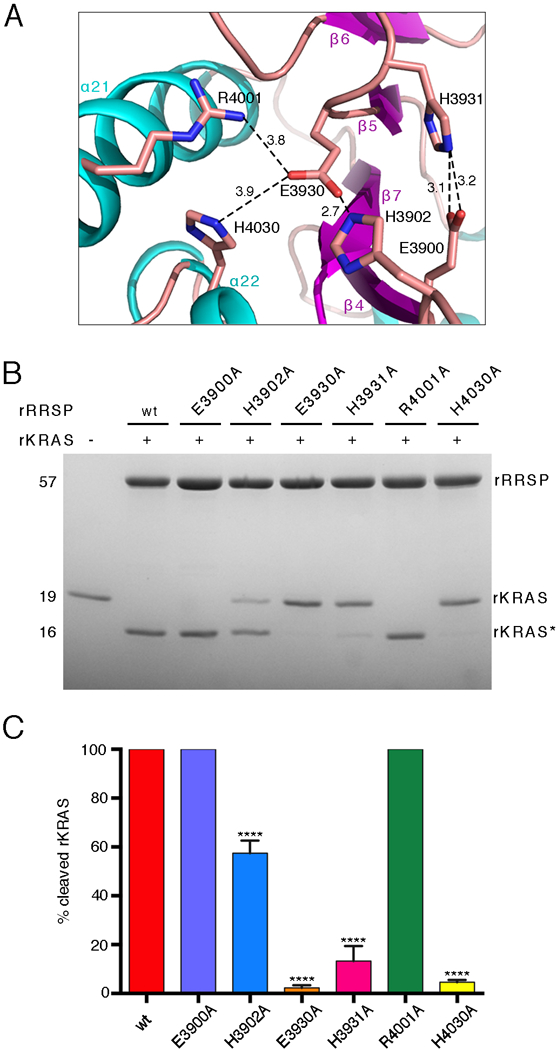
(A) Ribbon representation of the RRSP catalytic site. Sticks indicate the side groups of the residues substituted with alanine in our experiments. Amine groups and carboxyl groups are colored in blue and red, respectively. Polar interactions between residues are depicted by dotted lines with distances indicated in Å. (B) Representative SDS-PAGE analysis of the reaction product(s) of 10 μM rKRAS and 10 μM of each indicated rRRSP mutant following 30 min in vitro incubation. (N=3 independent experiments) (C) Quantification of rKRAS cleavage efficiency of rRRSP mutants shown in (B), bars are color coded by mutant. The bar graph reports means ± SD of three independent biological replicates (ANOVA followed by Dunnett’s multiple comparisons test; ****P≤0.0001).