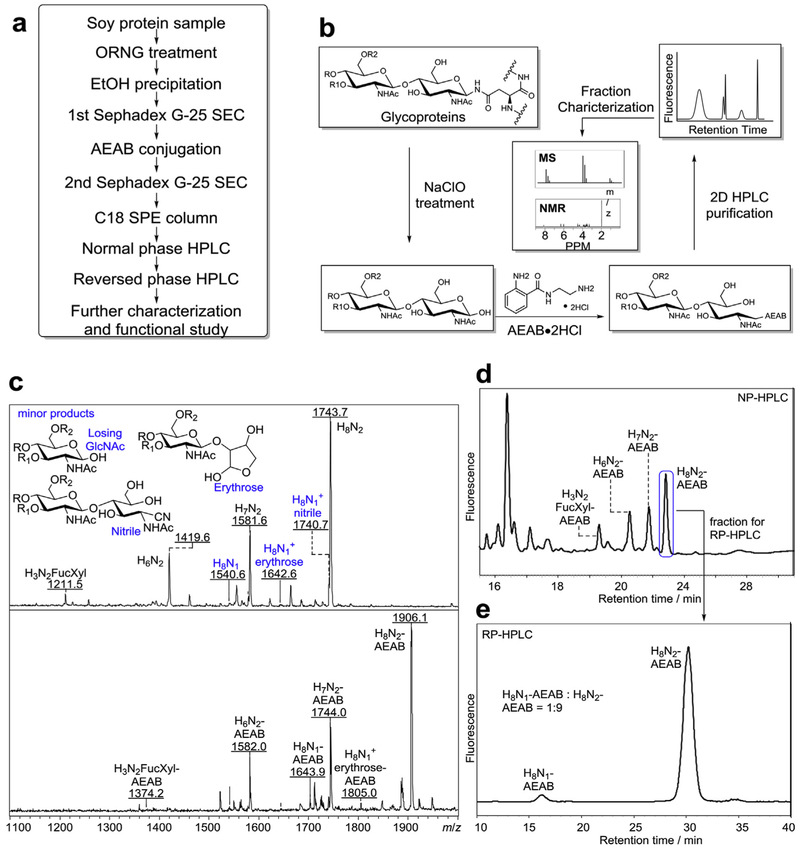
Fig. 1. Oxidative Release of Natural Glycans from soy proteins.
a) Overview of the procedure for the production of tagged N-glycans released by ORNG method, b) Scheme of oxidative release of N-glycans, tagging the reducing glycans, HPLC separation of the AEAB conjugated glycans, and characterization of AEAB-glycans by MS and NMR. c) Top: mass spectra of N-glycan fraction (Fig. S1a) before conjugation with AEAB (M + Na+); Chemical structures at the reducing end of several side products were shown. Bottom: mass spectra of AEAB conjugated N-glycan fraction (Fig. S1b), d) Normal phase HPLC profile (250 × 4.6 mm amine column) of AEAB conjugated N-glycan fraction (composition of fractions determined by MS), e) C18 reversed phase HPLC profile (250 × 4.6 mm C18 column) of the single peak collected from (d) showing well-separated H8N1-AENB and H8N2-AEAB. (H = hexose, N = N-acetylglucosamine, Fuc = fucose, Xyl = xylose).

