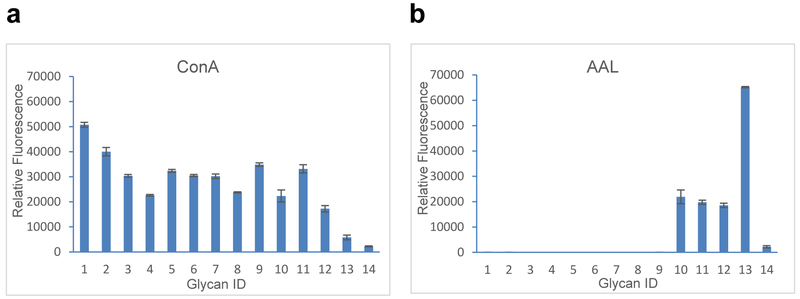
Fig. 6. Plant lectin binding on the glycan microarray of purified soy protein N-glycan-AEAB conjugates.
X-axis represents glycan ID while Y-axis represent relative fluorescence unit of bound proteins (Glycan ID 1–13, Table 1, Glycan ID 14: Biotinylated BSA (negative control)). Error bars represent standard deviation of 6 replicates, a) binding of Concanavalin A (ConA), b) binding of Aleuria aurantia lectin (AAL).

