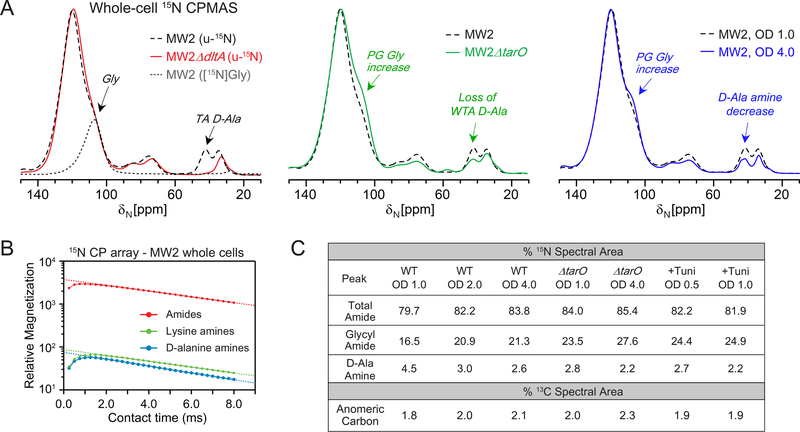
Figure 4. 15N CPMAS spectra of S. aureus whole cells.
(A) 15N CPMAS spectral comparisons of MW2 (black) with MW2ΔdltA (red), and MW2 ΔtarO whole cells, all harvested at OD 1.0, and MW2 cells harvested at OD 4.0 (blue). A sample labeled selectively with only [15N]glycine (dashed grey) shows the specific chemical shift contributions of the glycyl amides, abundant in the cell wall (left panel). All spectra are scaled to the amide peak and were acquired with 32,768 scans. (B) CP array experiments were performed to examine the 1H-15N CP buildup and decay, yielding similar slopes for lines extrapolated from the long contact times for amide and D-Ala amine nitrogens. (C) The percent nitrogen spectral area is tabulated for total amides, glycyl amides, and D-Ala amines. The percent carbon spectral area is tabulated for the resolved anomeric carbon peak in each spectrum.

