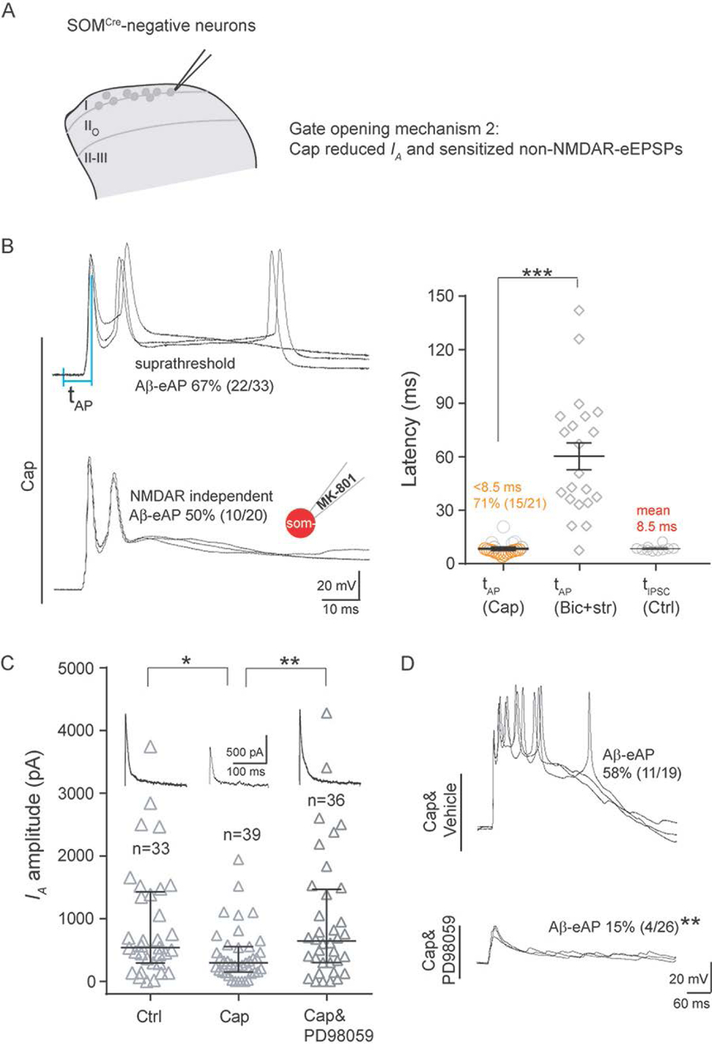
Figure 5. Capsaicin treatment reduced IA in SOMCre-negative neurons within I-IIo.
(A) Schematics showing of recorded neurons and our proposed gate opening mechanism 2 by capsaicin (“Cap”).
(B) Induction of NMDAR-independent Aβ-eAPs by Cap. Left: representative traces of Aβ-eAPs recorded from slices from Cap-treated mice, with internal solution not containing (“Cap”) or containing MK-801 (“Cap, MK-801)”. Right: latency comparison showing shorter latencies of Aβ-eAPs (tAP), in Cap-injected mice under the normal ACSF condition (“tAP, Cap”) in comparison with that in naive mice under the disinhibition condition (“tAP, Bic+str”; two-tailed Student’s unpaired test, ***p < 0.001). “tIPSC, Ctrl” referred to as the latencies of IPSCs under the normal ACSF condition in naïve control mice. The inset of schematic recording electrode indicates intracellular application of MK-801 (2 mM). See Figure 2C for latencies defined by the intervals of two vertical blue lines.
(C) Comparison of IA amplitudes in SOMCre-negative neurons from mice without Cap (“Ctrl”) treatment, with Cap treatment (“Cap”), or with intrathecal injection of the MEK inhibitor PD98059 (10 μl, 0.5 μg, i.t.) at 0.5 hour before Cap treatment (“Cap&PD98059”). Note IA reduction by Cap treatment (Mann-Whitney Rank Sum Test, *p < 0.05) and the reduction can be prevented by PD98059 treatment (Mann-Whitney Rank Sum Test, **p < 0.01).
(D) Abolishment of Cap-induced Aβ-eAPs by PD98059 treatment (10 μl, 0.5 μg, i.t) (Chi-square test, **p < 0.01). Representative traces of Aβ-evoked outputs in SOMCre-negative neurons within I-IIo with vehicle (“Cap&Vehicle”) or with PD98059 (“Cap&PD98059”) treatment.
Recordings in B and D are composed of three traces. Recordings in C represent the average from five repeated traces. Data in B are represented as means ± S.E.M. Data in C are represented as interquartile range (Q1–Q3 with median denoted in between). See also Figures S6–S8, and S10.

