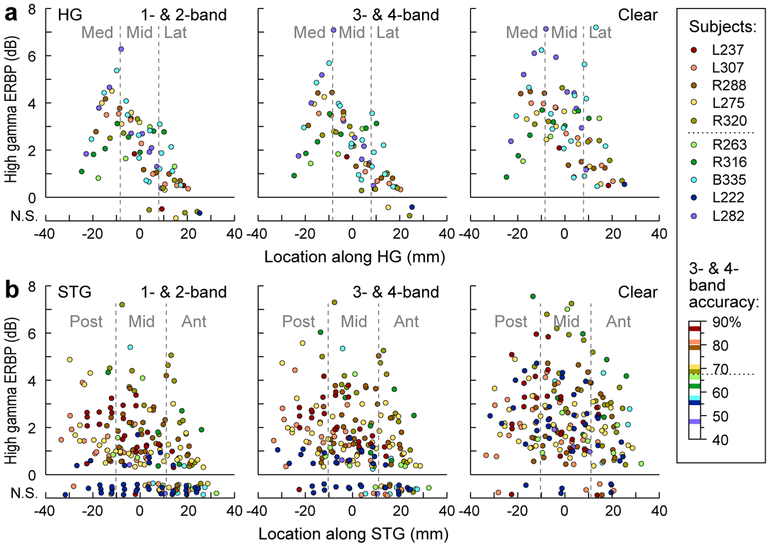
Figure 5.
High gamma ERBP across the length of HG and STG. Data from all electrodes in all 10 subjects. a: High gamma ERBP recorded from HG in response to 1- & 2-band vocoded, 3- & 4-band-vocoded and clear stimuli (left, middle and right panels, respectively) for each site, plotted as functions of location along HG. Sites where high gamma ERBP failed to reach significance (one-sample one-tailed t-test, p = 0.05, FDR-corrected) are plotted on the bottom of each panel, with jitter added to the Y-coordinate for clarity. Colors represent individual subjects, ranked by average identification accuracy in the 3- & 4-band condition (see Fig. 1). Dotted line in figure legend corresponds to a cutoff of 67.5% accuracy, used to differentiate good from poor performance on the task. b: Same analysis, shown for STG electrodes.

