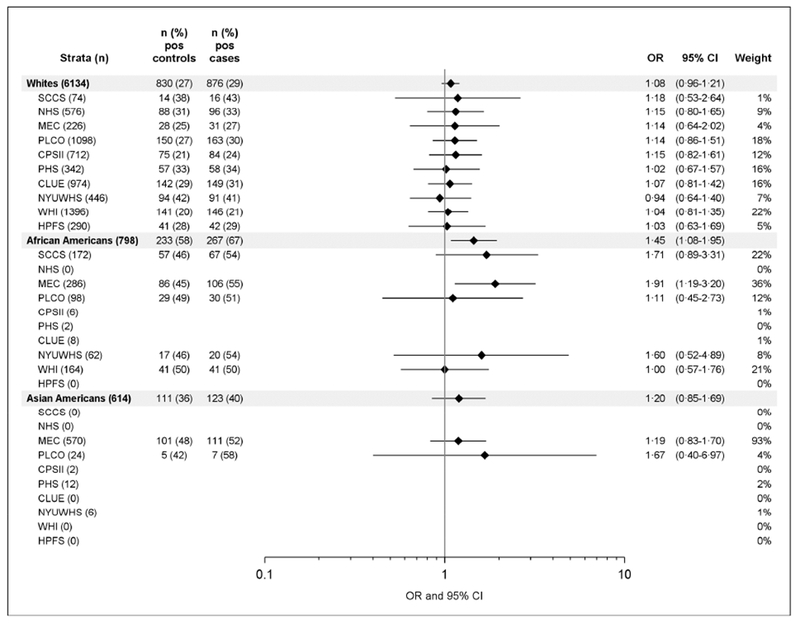
Figure 1: Forest plot of sero-positivity to H pylori VacA and CRC risk by race/ethnicitiy and study.

Conditional logistic regression models were applied to determine OR (diamonds) and 95% CI (horizontal lines), controls are matched to cases by study, age, sex and race/ethnicity. No values are given when total case numbers are below 20. Weight shows the contribution of each study to the number of participants per race/ethnicity in %. The vertical line at an OR of 1 serves as a reference for null association. Pos = antibody positive.
