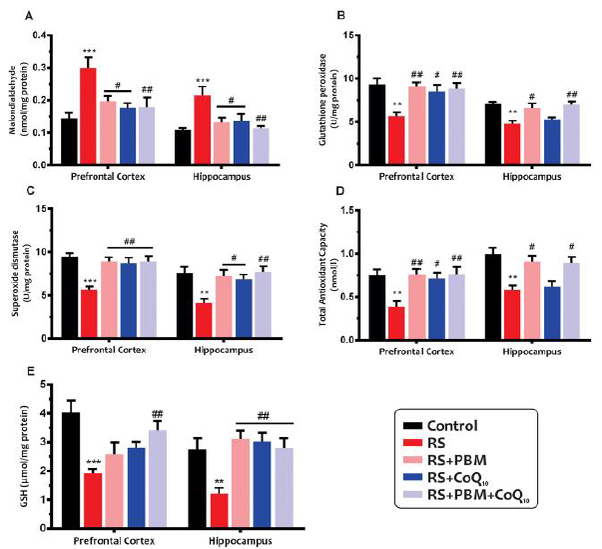
Fig 2:

Effects of PBM and/or CoQ10 therapies on the A) MDA, B) GPx, C) SOD, D) TAC, and E) GSH levels in the PFC and HIP areas after the restraint stress paradigm. n = 6. Data represent mean ± S.E.M. **p < 0.01, ***p < 0.001 vs. control group. #p < 0.05, ##p < 0.01, ###p < 0.001 vs. RS group. (CoQ10, coenzyme Q10; GPx, glutathione peroxidase; GSH, glutathione; HIP, hippocampus; MDA, malondialdehyde; PBM, photobiomodulation; PFC, prefrontal cortex; RS, restraint stress; SOD, superoxide dismutase; TAC, total antioxidant capacity).
