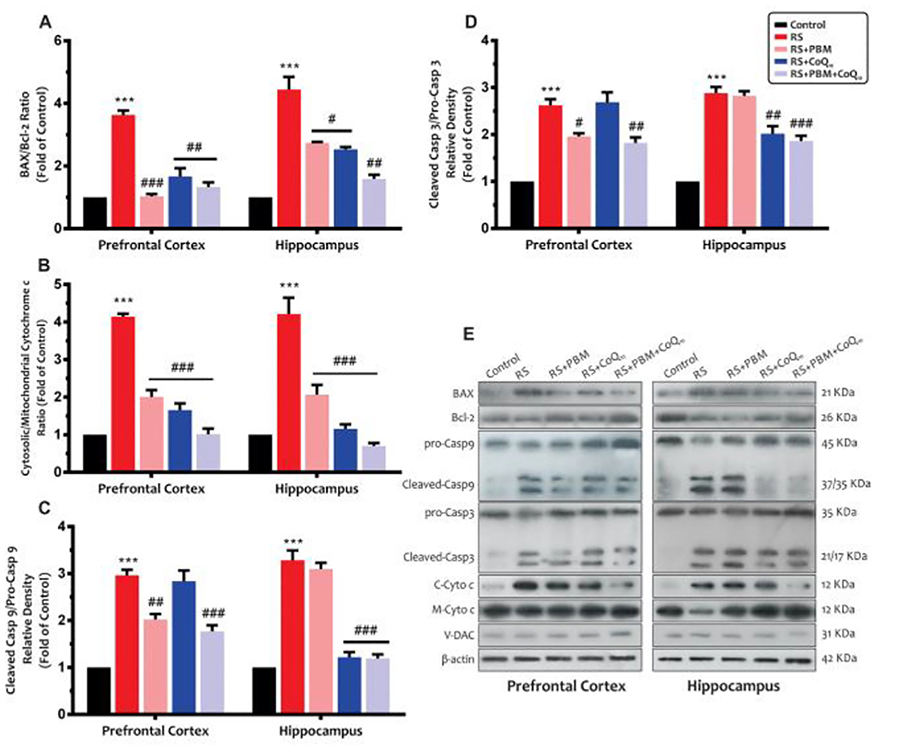
Fig 5:

Effects of PBM and/or CoQ10 therapies on the A) BAX/Bcl-2 ratio, B) cytosolic/mitochondrial cytochrome c ratio, C) caspase-9, and D) caspase-3 expressions in the PFC and HIP areas after the restraint stress paradigm. E) Representative images of corresponding protein levels detected by Western blot. The β-Actin, VDAC, and Cyt. c were used as cytosolic and mitochondrial internal controls, respectively. n = 3. Data represent mean ± S.E.M. ***p < 0.001 vs. control group. #p < 0.05, ##p < 0.01, ###p < 0.001 vs. RS group. (CoQ10, coenzyme Q10; HIP, hippocampus; PBM, photobiomodulation; PFC, prefrontal cortex; RS, restraint stress).
