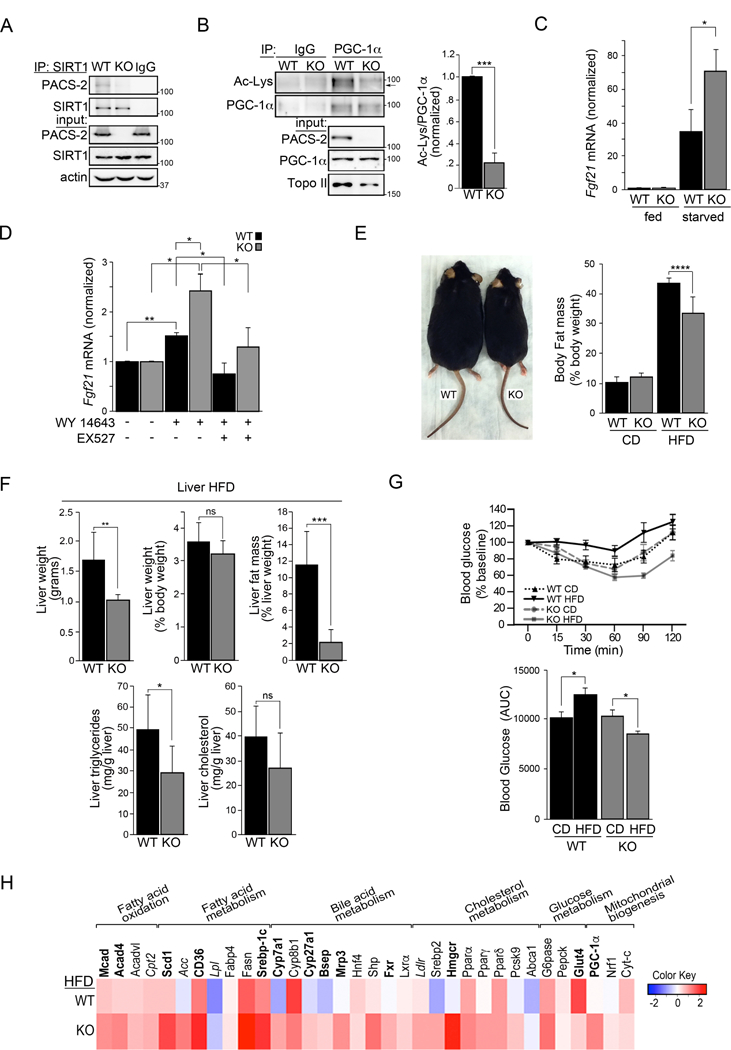
Figure 6: PACS-2−/−mice have elevated SIRT1 activity and are resistant to diet-induced obesity.

(A) Endogenous SIRT1 was immunoprecipitated from WT and PACS-2−/−liver. Co-precipitating endogenous PACS-2 was detected by western blot, n = 3. (B) Endogenous PGC-1α was immunoprecipitated from WT and PACS-2−/−liver. Acetylated-PGC-1α was detected by western blot. Data are mean ± SD, n=3. (C) RT-qPCR of FGF21 RNA from WT and PACS-2−/−mouse livers following a 14 hr fast. Data are mean ± SD, n = 4 mice per group. (D) Isolated WT and PACS-2−/−mouse primary hepatocytes were starved overnight and treated for 6 hr with 10 µM WY-14643 ± 10 µM EX-527. FGF21 was measured by RT-qPCR. Data are mean ± SD, n = 3. (E) Left: WT and PACS-2−/−mice after 8 weeks HFD. Right: Body fat mass of 8 weeks HFD WT and PACS-2−/−mice. (F) Liver weight, liver fat mass, liver triglycerides and liver cholesterol from WT (n = 6) and PACS-2−/−mice (KO, n = 13) following 8 weeks of HFD. Data are mean ± SD. (G) Top: Insulin tolerance test (ITT) response curves of WT and PACS-2−/−mice fed a CD or HFD for 8 weeks. Bottom: ITT data presented as area under the curve (AUC). Data are mean ± SD, n=6 mice per group. (H) RT-qPCR of RNA from WT and PACS-2−/−mouse livers following HFD challenge. Heatmap (Log2 scale) for HFD values normalized to CD was generated using R (n = 6 mice per group). Black bold letter, P<0.05; italics, P < 0.07, Gray letters, NS.
