
Figure 1 (Key Figure):
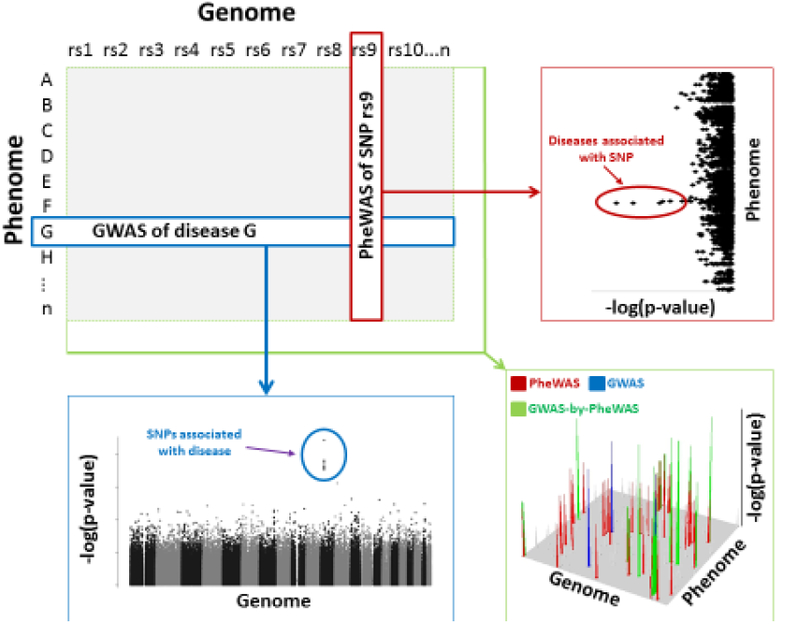
Schematic representation of a genome-wide association study (GWAS) (blue) and phenome-wide association study (PheWAS) (red) relative to a GWAS-by-PheWAS (green). Included are examples of corresponding results and significant findings.