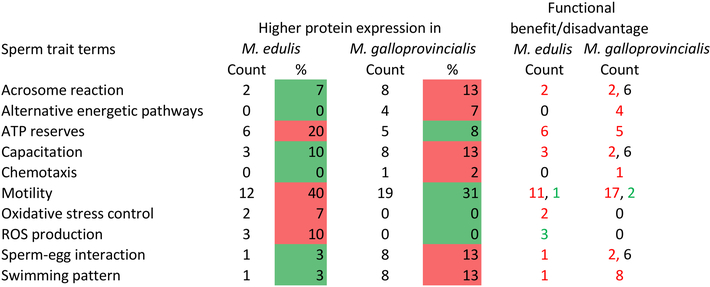
Figure 7:
Summary of counts and percentages of sperm trait and functional terms for proteins having higher expression in M. edulis and M. galloprovincialis. The data is derived from Table 3 and from File S7, worksheet Table S7 where it is further elaborated (see captions of Tables S6-S7). Columns 2–5 give the counts and % values of sperm trait terms assigned to proteins having higher expression in M. edulis and M. galloprovincialis. Red and green fill indicate higher and lower % values in each row. Columns 6 and 7 indicate the number of occurrences of terms according to a tentative hypothesis on perceived benefit of higher expression to the species at the head of the columns (in red font) or perceived disadvantage (green font). Black font indicates that a conclusion in relation to benefit or disadvantage could not easily be made.

